
Sometimes it’s very difficult to explain the short-term action in stocks. To be clear, I’m reviewing short-term narratives on the week-to-week action in the overall market, not tick by tick action which is left to technical analysis, writes Don Kaufman Saturday.
The trade war narrative is difficult to grasp because it has been inconsistent. Inconsistencies are actually a good thing if you want to make money.
If stocks always are accurately priced, you can’t profit off them. In this case, if every risk was accurately determined by using the expected value formula, you couldn’t short stocks and make money. We know it’s possible to exploit inefficiencies in the market, so let’s review the narrative change.
Stocks originally sold off this spring because of worries about a possible trade war. You can say the market already mistakenly determined the risk of a trade war because it rallied after Donald J. Trump was elected without considering the potential for a trade war even though he discussed it often.
Stocks rebounded on the possibility that the trade war drama would be resolved amicably and the fact that the initial tariffs were puny. Now we have stocks at their all-time high even though President Trump could be taxing all the imports from China. I’m not saying stocks need to be at the February lows, but the fears from earlier this year coming true shouldn’t be ignored.
Trade war or skirmish
It’s interesting to hear Jamie Dimon claim this is a trade skirmish and not a trade war because the effect on the economy won’t be catastrophic. It’s fair to suggest it won’t crater the American economy, but there’s a lot of white space between not having a disastrous effect and not having any effect. Stocks are seemingly ignoring the trade war despite the increased rhetoric.
I don’t think China’s retaliation is good news. It’s just not the worst possible news. Dimon’s definition is based on the effect on the economy, while my definition is based on the potential impact a trade war can have.
If all the goods might be taxed a 25% rate, that’s close to as bad as it can get unless China stops buying U.S. Treasuries. Therefore, I think it is a trade war.
Tax cut versus trade policy
The image below explains the new narrative on the trade war with China. It shows the tax cuts help the economy by $745 billion, the spending boost helps by $315 billion, and the repatriation helps by $700 billion to $800 billion.
In Q2 companies repatriated $169.5 billion which is up from $34.9 billion in Q2 2017 and down from a downwardly revised $294.9 billion in Q1.
It’s estimated that $3 trillion in capital is overseas, but the recent trend doesn’t make it look like it all will come back. I don’t see the positive impact in the same way as the graphic. Firms used to borrow against overseas capital to bring it home and now they are just directly bringing it home.
Therefore, I don’t think there will be a $700 billion to $800 billion benefit.
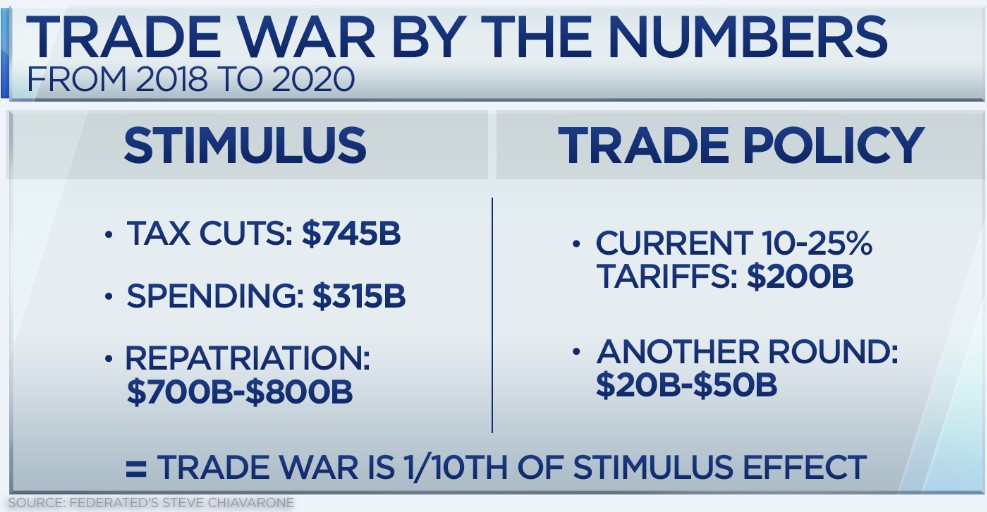
The graphic shows there are $200 billion in tariffs at between a 10% and 25% rate and there could be another round between $20 billion to $50 billion.
This ignores the potential for President Trump to tax all the goods coming from China. While some think there’s a multiplier effect from tax cuts, I think there’s a multiplier effect from tariffs. Increased prices can encourage fear and uncertainty which might make consumers save more than the increase in prices.
An example of this is how gas prices make consumers spend less money than the increased cost to fuel their cars. Gas is a relatively small part of the consumer’s budget, but it’s psychologically important partially because consumers need to drive to make most purchases and because the price is in a big font at gas stations.
The tariffs won’t be blasted in a big headline font, but they do create uncertainty. There was a spurt of purchases to get out ahead of the metals tariffs.
Consumers and businesses might hold back on purchases because they think the tariffs will soon be reversed. If there’s a sharp decline in spending, it could encourage a new trade deal.
Midterm elections
The mid-term elections are in less than two months. The market is ignoring this potential risk which I think is correct because it won’t cause a massive near-term change in legislation. According to RealClearPolitics, there will be no change in the Senate which means the GOP will still control 51 seats. The House has 206 likely Democrat seats, 189 likely GOP seats, and 40 toss-ups.
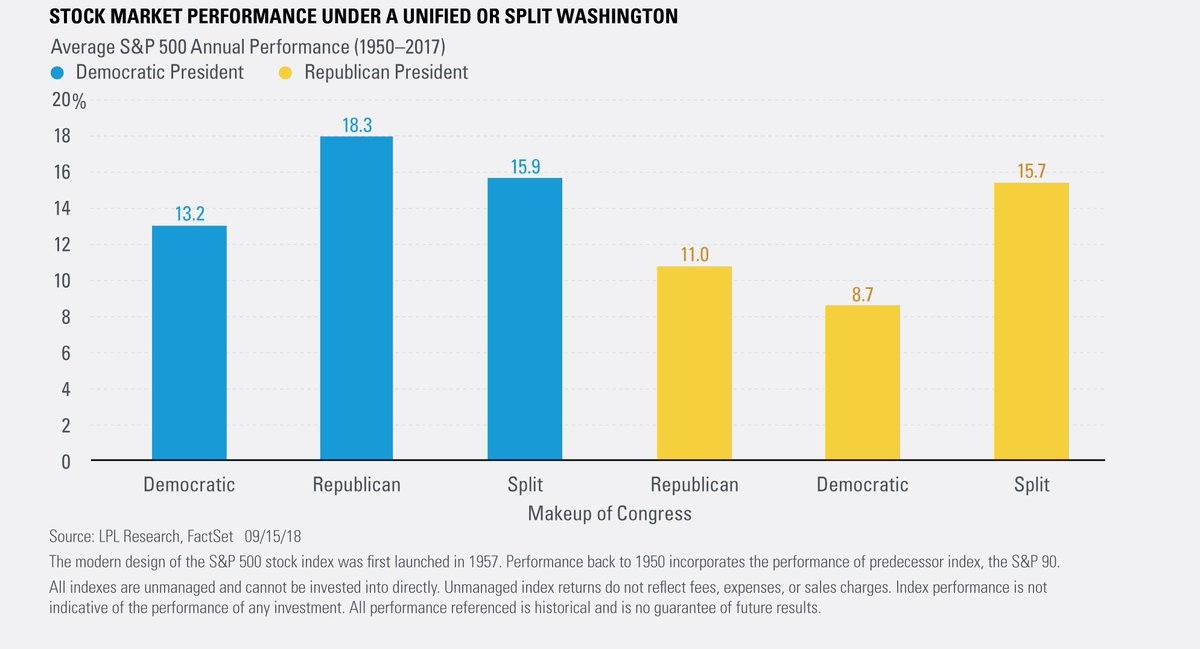
The chart below shows the returns under various political set ups. Unsurprisingly, the market is positive in every scenario. No matter what your political preference is, you shouldn’t sell long-term investments because someone you disagree with is in charge. Currently, we are in the first yellow bar which is the second to worst scenario, yet stocks have done well.
If the Democratic party wins the House and the GOP maintains control of the Senate, the average returns will go from 11% per year to 15.7%. A split Congress under a GOP president is the third best scenario.
Earnings update
The table below shows Q3 earnings with 8 firms reporting so far. As you can see, the average EPS growth rate is 25.9% and the average EPS surprise is 3.03%. 4 firms have beaten EPS estimates.
Sales growth is 12.27% with the average surprise being 0.55%; half of the firms beat estimates. The average tax rate is 8.98% which is way below the corporate tax rate which is 21%.
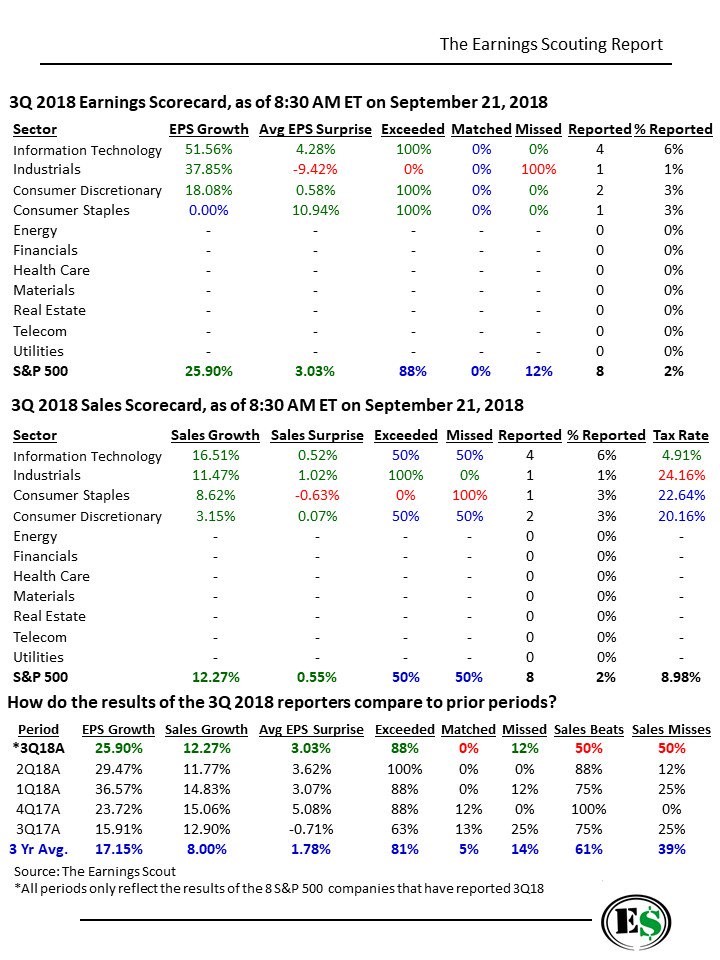
The bottom table is the most interesting because it shows the previous results after 8 firms reported. As you can see, the sales growth is higher than Q2 which had 11.77% growth.
However, Q2 had a 3.57% higher average EPS growth rate and a 0.59% EPS higher surprise rate. The current EPS growth and sales growth rates are much higher than the three-year average which was the case for the prior 3 quarters.
Subscribe to TheoTrade here...
View a brief video interview with Don Kaufman on volatility for traders and investors here
Recorded at TradersExpo New York Feb. 25, 2018
Duration: 2:34.


