
Walmart is indicating it might be time for a sale, of Walmart that is, notes John Rawlins.
The recent bull move in equities has pushed Walmart (WMT) to extreme levels. This is especially true in the daily QuantCycles Oscillator (see chart).
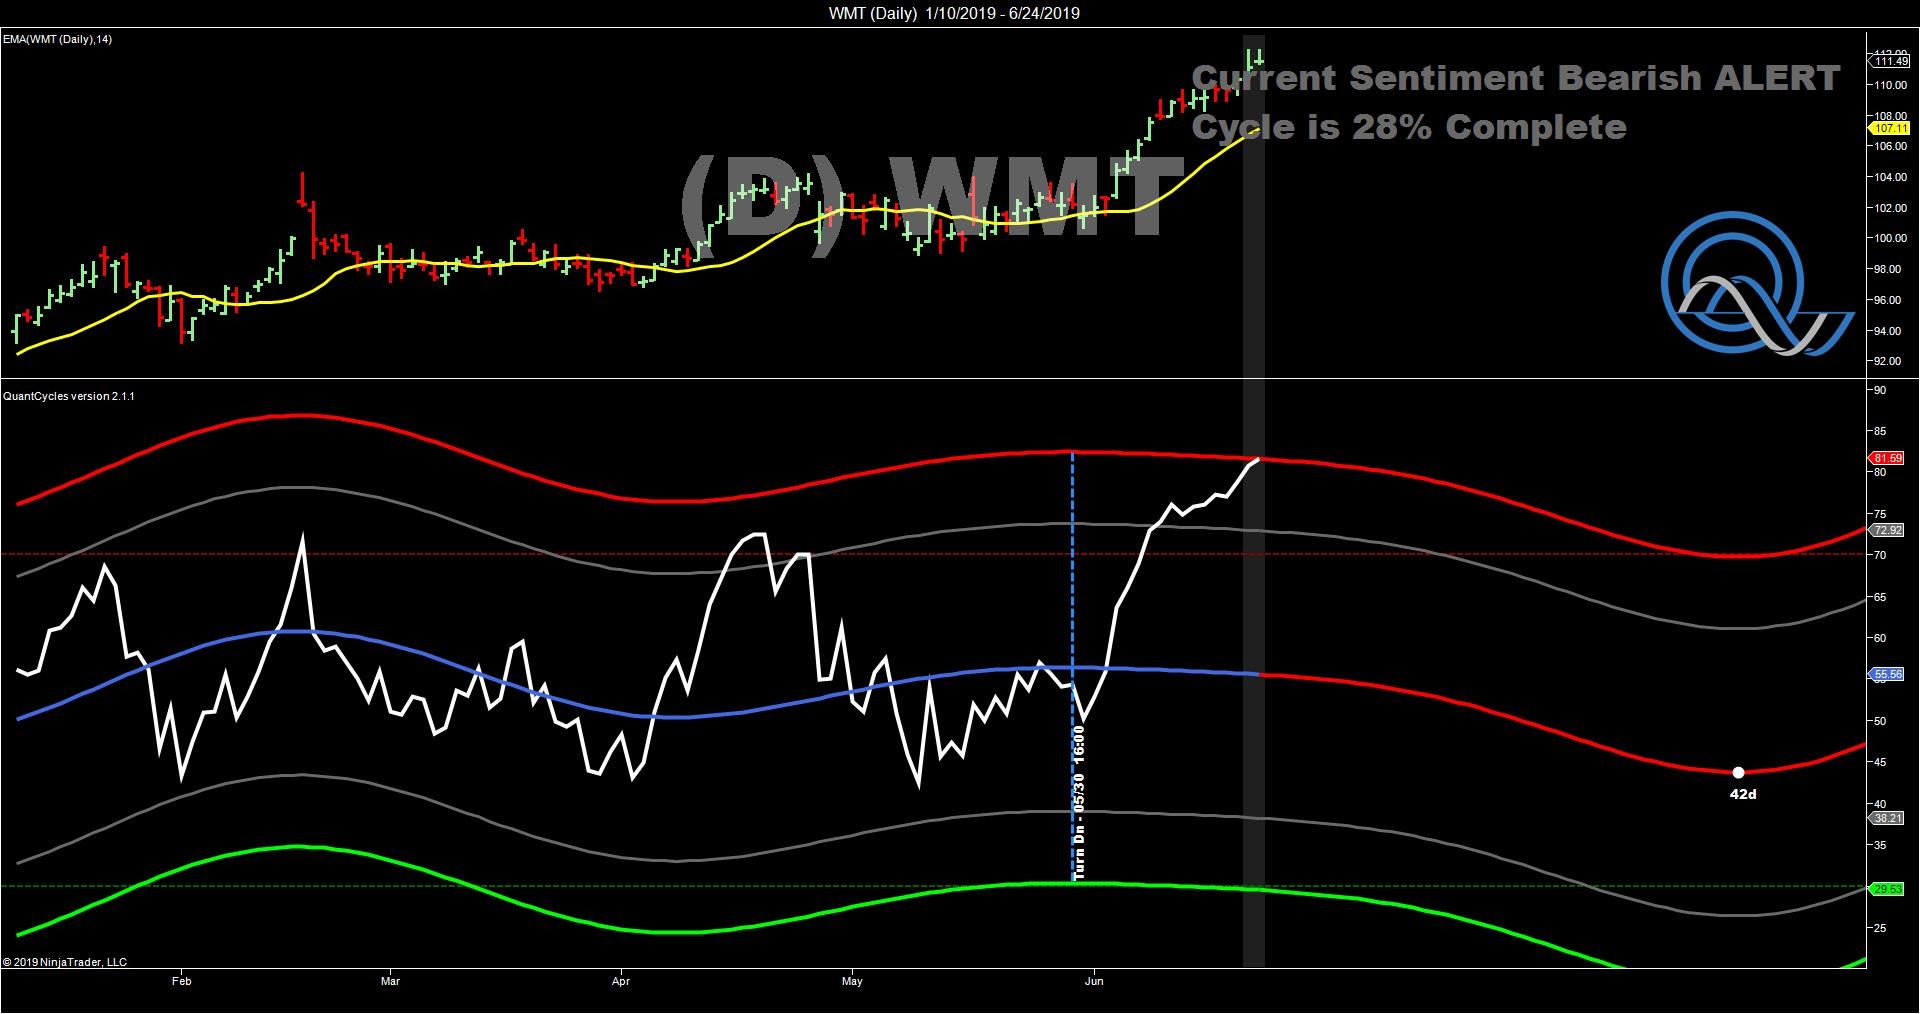
As you can see the daily QuantCycles Oscillator turned slightly negative at the beginning of June. The recent strength pushed the daily chart into extreme overbought conditions.
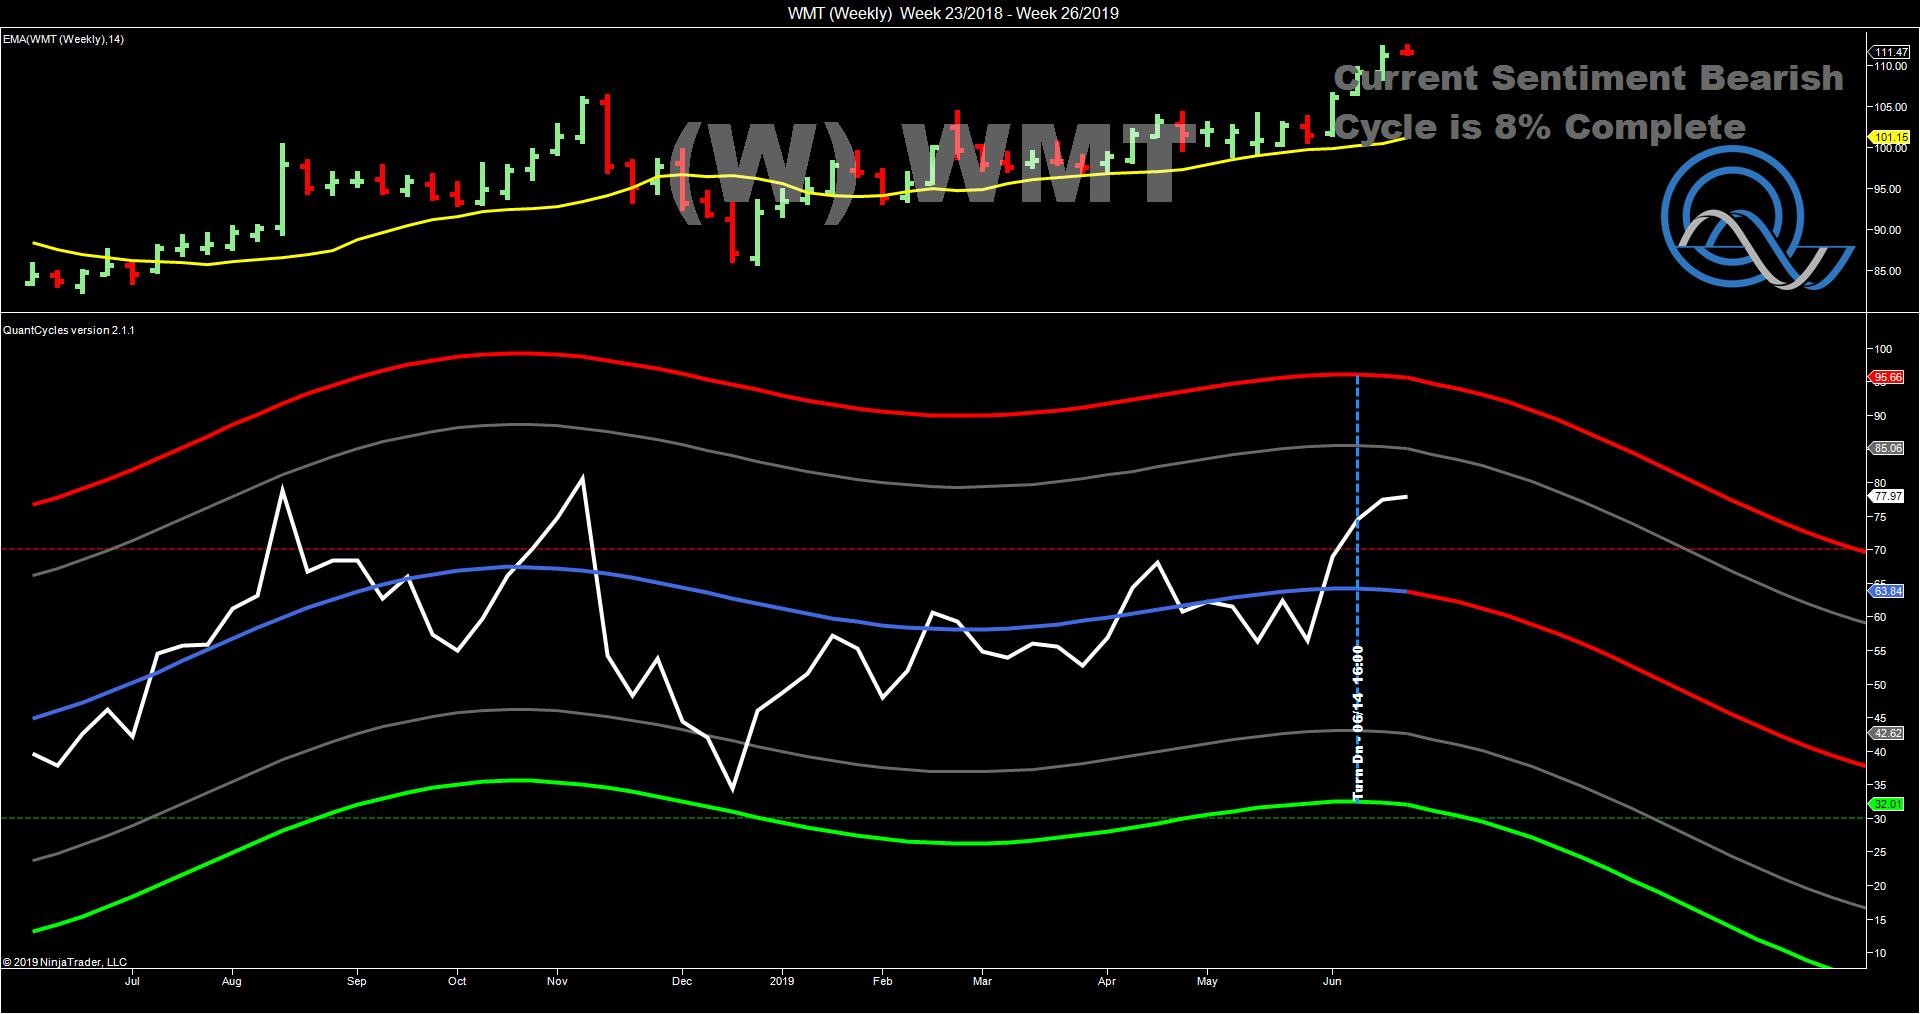
On a longer-term basis the QuantCycle is more bearish WMT, though not nearly as overbought (see chart).
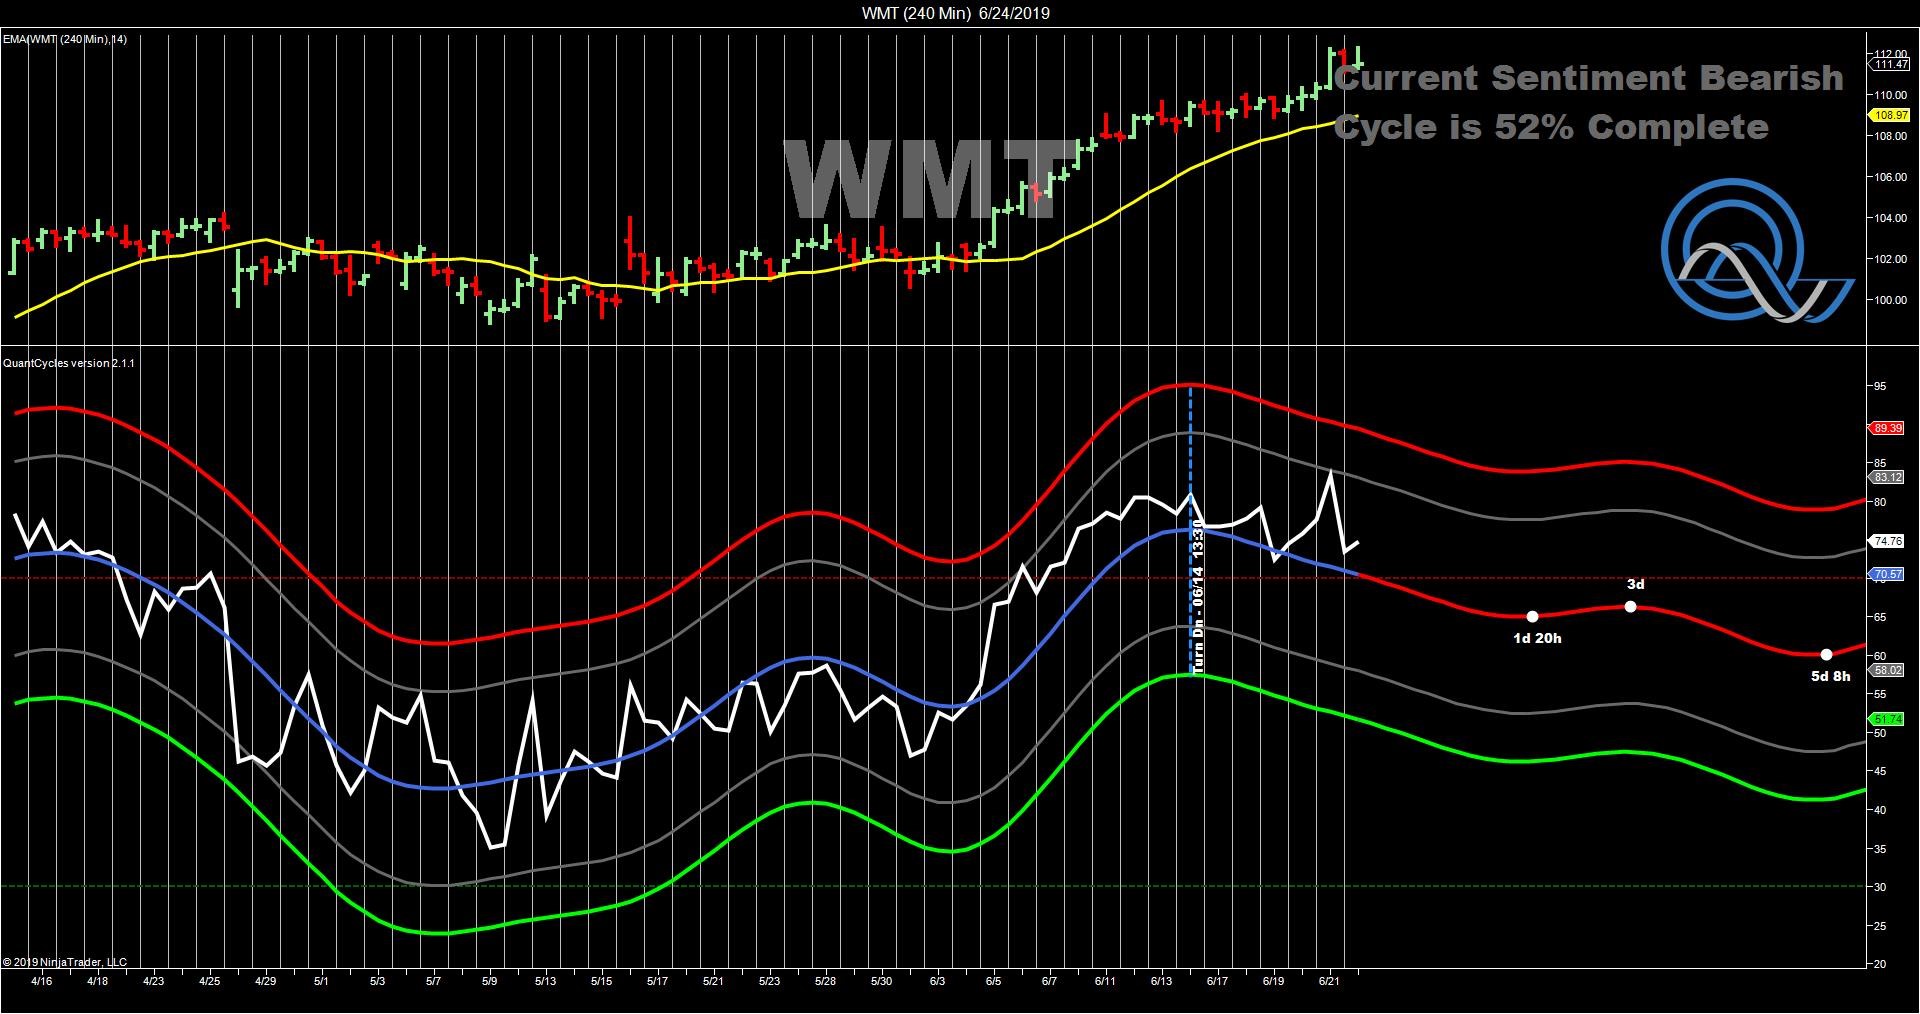
The short-term four-hour chart confirms the sell signal (see chart).
John Rawlins described the value of the QuantCycles Oscillator recently at The Orlando MoneyShow.
The QuantCycles indicator is a technical tool that employs proprietary statistical techniques and complex algorithms to filter multiple cycles from historical data, combines them to obtain cyclical information from price data and then gives a graphical representation of their predictive behavior (center line forecast). Other proprietary frequency techniques are then employed to obtain the cycles embedded in the prices. The upper and lower bands of the oscillator represent a two-standard deviation move from the predictive price band and are indicative of extreme overbought/oversold conditions.


