
The E-mini S&P 500 needs to fall below 2800 before the bulls will buy again. It might test the June low, writes Al Brooks.
The E-mini S&P 500 monthly chart has a big bear bar in August (see chart). The weekly and monthly charts were likely to form an expanding triangle top. However, after the July bar broke above consecutive outside bars in May and June, there was only a 40% chance of a major trend reversal into a bear trend.
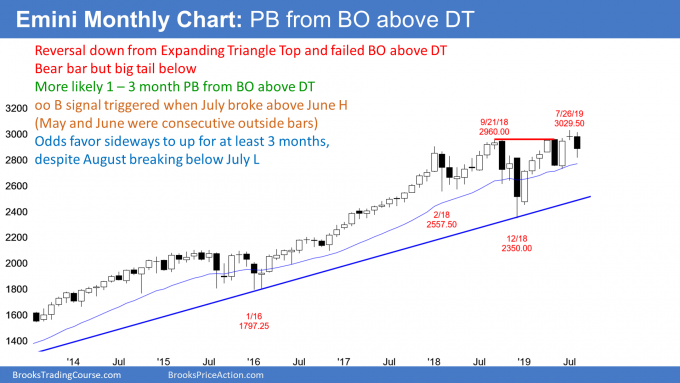
As strong as the August selloff has been, it is still only a one-month pullback in a strong bull trend. Traders should expect that the pullback to end within a month or two. The E-mini will then likely make a new high before there is a trend reversal into a bear trend.
What happens if the bears can create two or three big bear bars closing on their lows? The odds would then shift in favor of a test of the December low. At the moment, they only have a 30% chance of achieving their goal before there is a new high.
What about the inverted yield curve?
Last week was the first time in 12 years that the yield on two-year Treasury notes was higher than that of the 10-Year Treasury notes, creating an inverted yield curve—a common predictor of a recession. The yield curve is said to invert when shorter-term interest rates have higher yields than longer-term interest rates. While it is the first time the two-year/10-year note spread inverted—a common yield curve benchmark—interest rate benchmarks have inverted this year.
Why would investors be willing to earn so little when locking their money up for such a long time? It is because they have compared the 10-year note to other investments, like stocks and real estate, and decided that the low rate with the high security is their best choice. They clearly are not optimistic about the future. They are afraid that other investments will lose money.
An inverted yield curve is a buy signal!
An inverted yield curve is a reliable predictor of a recession. There have been nine instances of a 2/10 year yield curve inversion since World War II, and seven led to a recession. Depending on how one defines a recession, some say that all nine led to a recession.
But there is another statistic that usually gets overlooked. A yield curve inversion is a buy signal! Stocks rallied 15% on average 18 months after the inversion. The average time before a recession is 22 months (range of five to 34 months). Therefore, traders have a window when they can make money.
What happens once the recession hits? Not good. At 36 months after the inversion, the stock market is up only 2% from the time of the inversion.
It is reasonable to assume at this point that this inversion is similar to the others. If so, traders should expect a 15% rally over the next 18 months. But they should also expect the stock market to lose most of those gains over the next 18 months and be up only 2% from today’s level.
The two-year/10-year yield curve inverted last week and the S&P cash index closed the day at 2841. That means that in August 2022, the S&P might only be at 2898, even though it could rally to 3267 in February 2021.
The E-mini S&P 500 weekly chart has been in a trading range from 2750 to 2930 for five months (see chart). That range is in the top half of 20-month trading range from 2350 to 2930. There is no sign of an impending breakout.
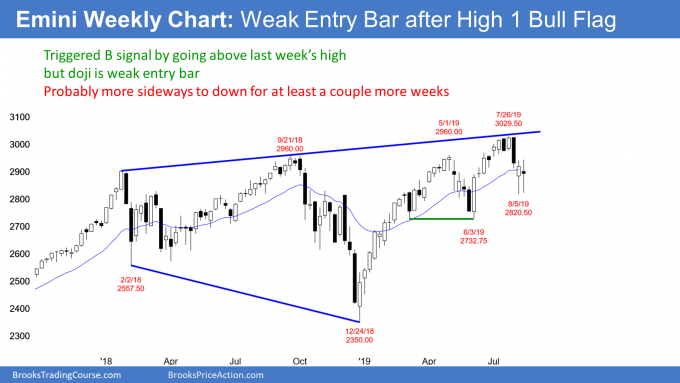
There was a big bull reversal bar two weeks ago. It was a High 1 buy flag and a buy signal bar for last week. Since it was a good looking buy signal bar in a bull trend, I said that the E-mini would probably go above its high last week to trigger the buy signal. And it did.
However, I also said that there would probably be more sellers than buyers above its high. Why would traders sell above a good looking buy signal bar? Because it was not as good as it looked. Context, which means the bars to the left, is important.
It followed a huge bear bar and a buy climax. After that bear bar and the buy climax, the odds were that the weekly chart would be sideways to down for at least a couple more weeks. That meant that the buy signal would fail.
In addition, the bar had a prominent tail on top. That further lowered the probability for the bulls. Also, it was a big bar. If a trader bought above its high and put a stop below its low, he would have a big risk. Since a lower high was likely, the reward was small.
It was a buy signal bar with bad risk/reward and low probability for stop entry bulls buying above its high. Since there is nothing in it for the bulls, there would probably be more bears selling with limit orders at the top of the buy signal bar. And there were.
While last week was the entry bar, it was a doji and therefore weak. The weekly chart will probably trade sideways to down for at least another couple weeks.
Double top with double bottom
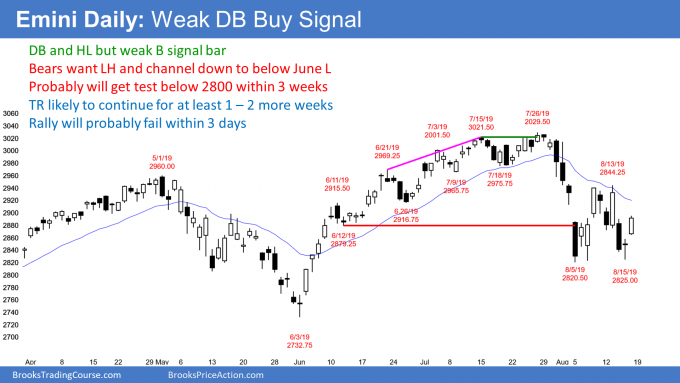
The daily E-mini S&P 500 chart formed a micro double bottom on Aug. 5 and Aug. 7. Thursday’s low was a test of the previous week’s low and there is now a double bottom (see chart). There is also a micro double top just below the 20-day exponential moving average. When a chart has both credible buy and sell signals, it is in a trading range.
The Big Up in June and July and now the Big Down in August has created Big Confusion. When there is confusion, traders bet against sustained moves up or down.
Traders are uncertain of the direction of the breakout. They expect reversals instead of a trend up or down. Traders buy strong selloffs, sell strong rallies, and take quick profits, betting against sustained moves. This creates a trading range.
The June/July rally was a typical Spike and Channel pattern, which I have discussed often. During the July bull channel, I noted that there would be a break below the bull channel, a test of the June 12 start of the bull channel, and then a trading range. The market is behaving as was likely, although the bars and legs have been bigger than what was likely.
Traders are now deciding if the two-week selloff is a 50% pullback from the June/July rally or the start of a trend down to below the June low.
Both outcomes can happen. The selloff is strong enough so that traders should expect it to continue down to at least a little below the Aug. 5 low and test 2800. But it might not be strong enough to fall below the June low of 2732.75.
Over the next week, traders will continue to look for reversals every few days. But the odds favor a test below 2800 within a couple weeks.
Trading Room
Traders can see the end of the day bar-by-bar price action report by signing up for free at BrooksPriceAction.com. I talk about the detailed E-mini price action real-time throughout the day in the BrooksPriceAction.com trading room. We offer a two-day free trial.


