
This indicator is signaling a decline in the S&P 500 of 5% or more in the next week, reports Ashraf Laidi.
Every once in a while, a chart like this comes around. Each peak and subsequent decline in the S&P 500 of more than 5% over the past two years was predicted four to six sessions prior by this mystery instrument. At each occasion the ratio tested 70% on the relative strength index (RSI). Is it as perfect as it appears?
Those who have shorted equity indices over the past three weeks (like I have) were simply wrong. In each of the trades, I found some interesting technical/sector signals that seemed to have been flashing the sell signal. But none of those proved correct. Even as I was only expecting a 2% to 3% drop, that just did not happen. So, what does this chart below tell us? Is it perfect in calling SPX declines?
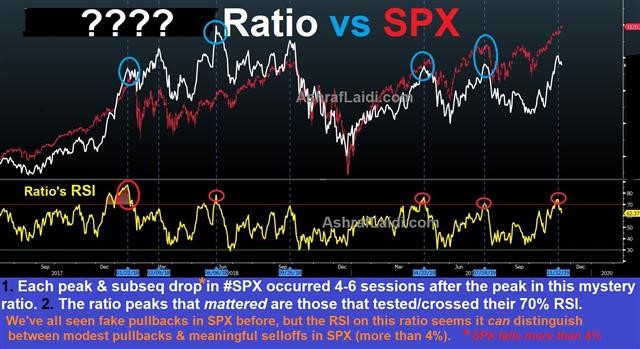
The mystery instrument (white) is a ratio, which acted as a flawless leading signal for declines in the SPX. Note that each time the ratio tested/crossed its 70% RSI, the SPX fell by at least 5%. More importantly, the peak and subsequent selloff in the ratio occurred four to six trading sessions prior to the fall in the SPX. I will investigate this one closely this week, before deciding whether to pull the trigger on the SPX or other indices. If you guessed the ratio, please notify me.
You can see Ashraf’s daily analysis at www.AshrafLaidi.com and sign up for the Premium Insights. Ashraf Laidi recently talked about the Dollar, gold and the Chinese yuan Triangularity at TradersEXPO New York.


