
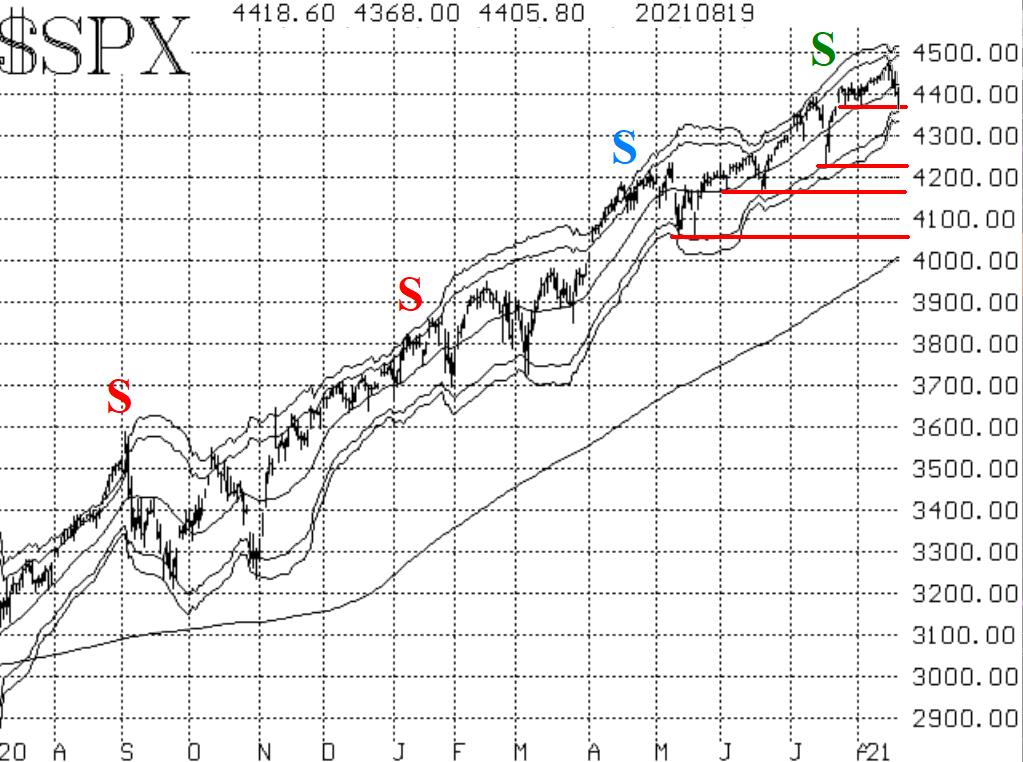
The key to whether the market is bullish or bearish is S&P 500 (SPX) support at 4370. The end of last week, the SPX traded right down to that level and bounced up from there again, says Larry McMillan of Option Strategist.
That is the third time in less than a month that SPX has bounced off of that level. Hence, it is valid and substantial support. If it gives way, there will likely be surge of selling. But as long as that support at 4370 holds, the SPX chart is still bullish, with moving averages trending upward.
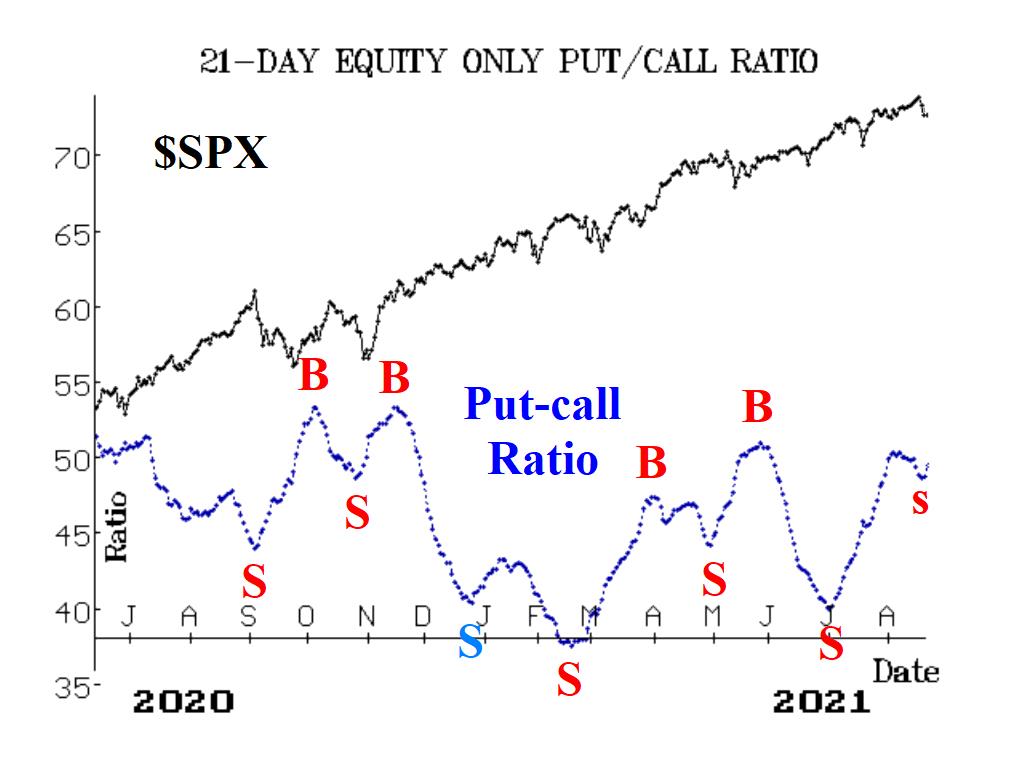
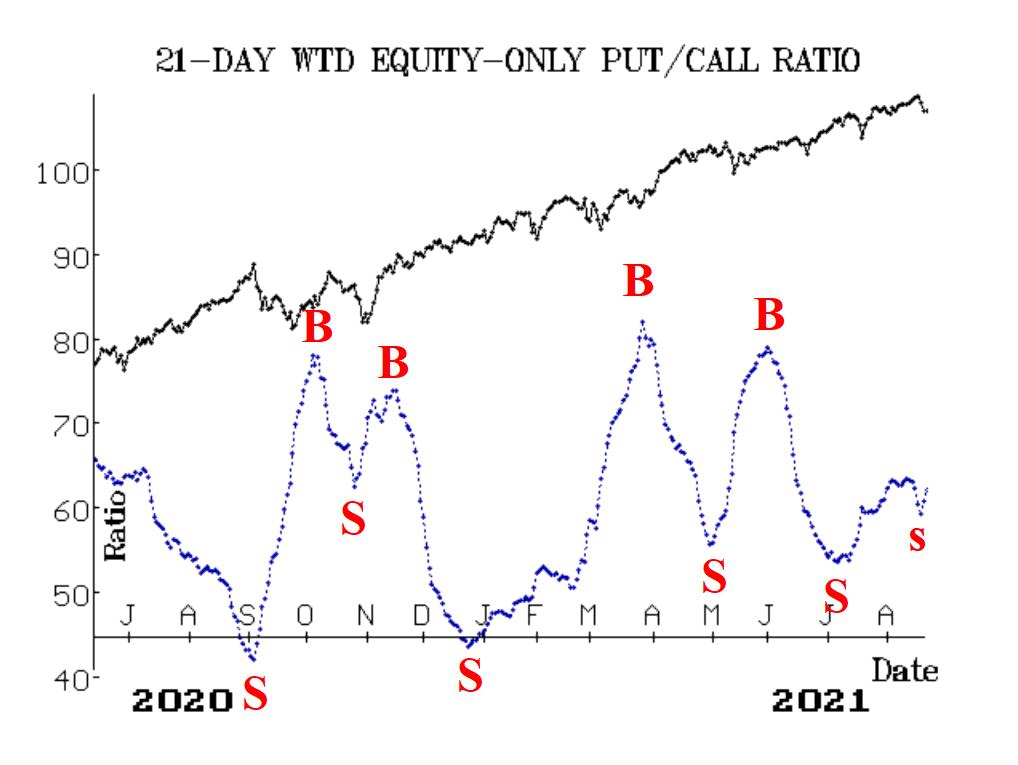
Equity-only put-call ratios remain on sell signals. They appeared to be curling over last week, but the computer analysis programs were adamant that the sell signals were still in place.
Market breadth has deteriorated badly. Not only are both breadth oscillators on sell signals, but they have now descended into deeply oversold territory. That means a buy signal lies in the somewhat near future, although oversold does not mean buy.
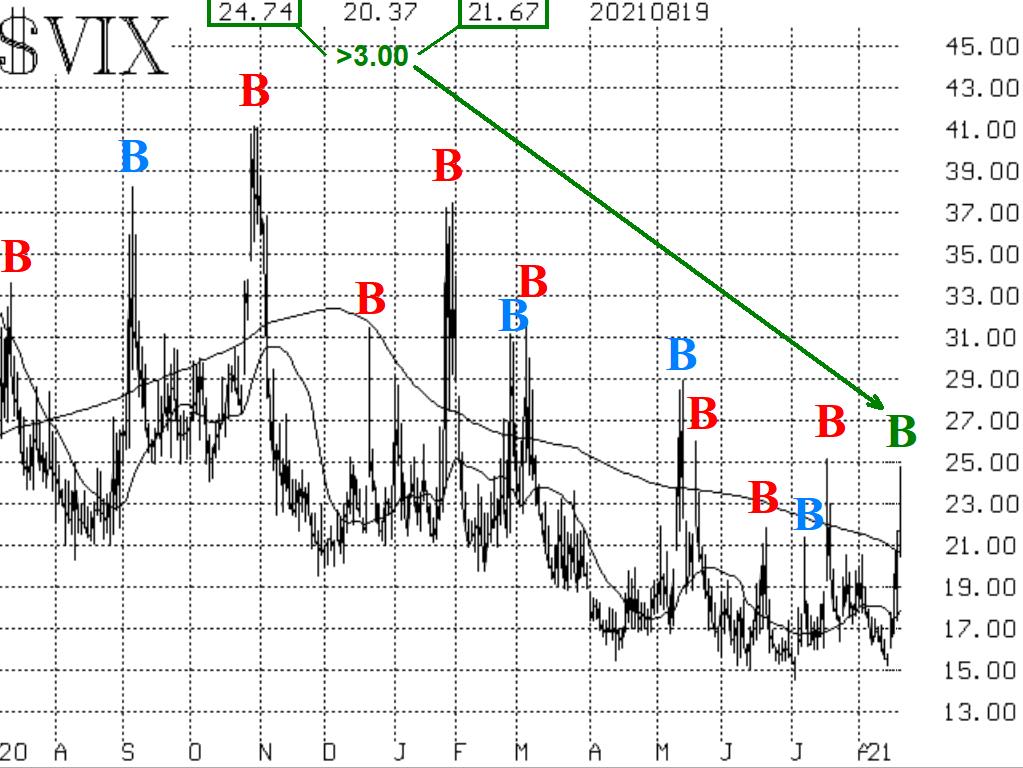
The CBOE SPX Volatility Index (VIX) "spike peak" buy signal of July 20 was nearing its 22-day "expiration date" this week, when it was stopped out on August 18, by the fact that VIX returned to "spiking mode." A a new VIX "spike peak" buy signal was confirmed.
So, we have mixed signals, accurately reflecting the dichotomy between the strength of SPX and the weakness of the "average" stock. We will trade confirmed signals in either direction, with the proviso that the overall "core" position should remain bullish as long as SPX holds above support at 4370.


