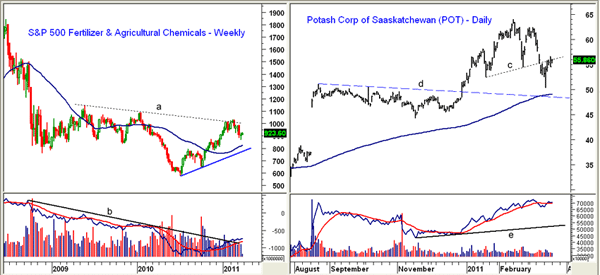
The sector remains strong, and the stocks of three industry leaders have all pulled back to good support, likely setting up good buying opportunities.
The sharp decline in the world markets last week took many of the major averages, as well as individual stocks, back to key support levels that correspond to last fall's highs. In an uptrend, these are the levels that should hold on a correction.
One of the few sectors that bottomed late by forming lower lows in 2010 is the S&P 500 Fertilizer and Agricultural Chemical Group. This industry has had a strong rally from the July 2009 lows, and three fertilizer stocks, Potash Corporation of Saskatchewan (POT), The Mosaic Company (MOS), and CF Industries Holdings (CF) have all pulled back to good support, which is likely setting up a buying opportunity.
Chart Analysis: The S&P 500 Fertilizer & Agricultural Chemical group closed above the weekly downtrend (line a) in early February before correcting over 15% to last week's low of 871. This corresponds nicely with the November high at 872.
- The rising 40-week moving average (MA) is now at 827 with the weekly uptrend, line b, in the 772 area. A violation of this level would indicate that the major trend had turned negative
- The long-term downtrend in the on-balance volume (OBV), line b, was broken early this year, which is a positive sign. The daily OBV (not shown) suggests that the worst of the selling may be over
- The initial resistance at 930 has been reached with stronger resistance in the 960-975 area
Potash Corporation of Saskatchewan (POT) is the world's best-known fertilizer stock, but it's also known to be quite volatile, having peaked on February 14 at $63.96 before dropping as low as $50.25 last week.
- Last week's lows correspond to the 38.2% retracement support with the 50% level at $46. The still-rising 200-day MA is currently at $49.04
- POT has rebounded over the past few sessions, reaching the resistance (former support) at line c in the $55.80 area. From the daily chart, the corrective pattern does not yet appear to be completed
- It would take a daily close above $61.40 to signal that the lows were in place. Short-term support is now at $54.20-$53.40
- The daily OBV did confirm the recent highs and is still well above good support at line e. The weekly OBV (not shown) is confirming the price action
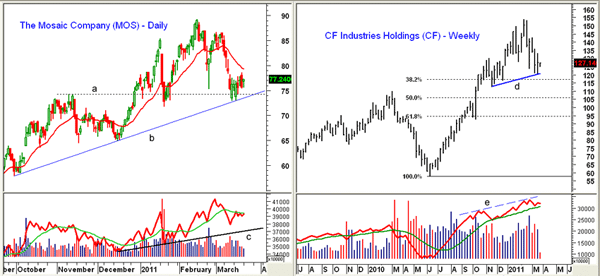
The Mosaic Company (MOS) has the best-looking chart of the three fertilizer stocks as last week's pullback tested the good support in the $73-$74 area and the November highs, line a.
- The uptrend on the daily chart, line b, is now at $73.40 with the 38.2% support at $69.65
- The daily OBV has made higher highs and is still well above the good support at line c. The weekly OBV (not shown) has dropped back to its weighted moving average (WMA)
- There is first resistance now at $78.65 with the still-declining 20-day exponential moving average (EMA) at $79.35. A close above this level would be a sign that the worst of the selling is over
- A daily close above $86.70 would complete the trading range and give upside targets in the $105-$108 area
CF Industries Holdings (CF) may not be as well known as Potash or Mosaic, but it is a US-based, $9 billion fertilizer company. From the February highs at $153.80, it hit a low of $120.32 last week, which is a top-to-bottom decline of 21.7%-ouch!
- The weekly chart now has trend line support (line d) in the $120.50 area. The 38.2% support is at $117.30 with additional weekly support now at $116.36
- The weekly OBV did confirm the recent highs (line e) and is holding well above its weighted moving average. The daily OBV (not shown) is still negative despite the recent bounce, which does allow of a test of the lows
- Initial resistance is now at $133 and then at $135.75. A daily close above
$141 should complete the corrective pattern
What It Means: The sharp decline in many of the commodity markets has also resulted in a sharp correction in most of the fertilizer stocks. Though this group did lag for the first part of 2010, the weekly charts are still positive. I will be watching the S&P 500 Fertilizer & Agricultural Chemical index for signs that this group is becoming a leader.
How to Profit: The stock market's rally from last week's
lows has been impressive, as the McClellan Oscillator (a short-term
advance/decline indicator) has jumped from -268 last Wednesday to +40 on Monday,
which is an area of strong resistance. If stocks can continue higher today and
close with nice gains, it would suggest that we have made a rare "v -shaped
bottom."
In the fertilizer stocks, I would look to buy on a setback towards
last week's lows. For POT, go long at $52.80-$53.56 with a stop at $49.83 (risk
of approx. 6.9%). Sell half the position at $61.22.
MOS should hold up better than POT if the market corrects. I would buy MOS at $73.20-$74.38 with a stop at $69.38 (risk of approx. 6.7%). Sell half the position at $84.77.
As for CF, I would buy at $122-$123.58 with a stop at $115.88 (risk of approx. 6.9%) and sell half the position at $138.77.


