As the market digests its recent gains MoneyShow’s Tom Aspray is looking at stocks in the homebuilders sector, which is now in a seasonally strong period.
The stock market held up pretty well Monday as the S&P 500 is bumping into the 50% Fibonacci retracement resistance in the 1408 area. The McClellan oscillator, a short-term A/D indicator, has risen from a low of -285 on November 15 to a high last Friday at +140. It has now turned lower and a further pullback is likely.
A market correction over the next week or so is expected to be a buying opportunity and, of course, the challenge is to find the sectors and stocks that are likely to be leading the next market rally.

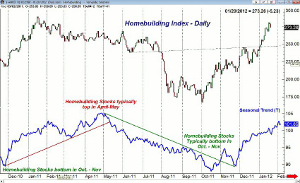
The volume surge in the homebuilding stocks in October 2011 suggested a low could be forming and the fundamental data has been very positive for most of the year. This chart of the homebuilder index, from early in the year, shows that the index typically bottoms in the October-November period and then peaks in April -May.
In the next week or so the leading homebuilders ETF, as well as three top homebuilders should drop back into their initial support zones where new buying could be done.
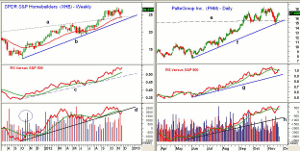
Chart Analysis: The SPDR S&P Homebuilders (XHB) has had a great year as it is up over 54% versus just a 14% gain in the Spyder Trust (SPY). Many may be surprised that only 26% of the ETF is invested in homebuilders with building products stocks making up over 29%.

- The weekly chart shows that XHB recently retested the breakout level, line a, in the $24 area, which also corresponded to the 20 week EMA.
- There is stronger support at $22.43, which was the May high.
- The weekly relative performance or RS analysis continues to look strong as it is well above its WMA, which was last tested in July.
- The RS line has been holding well above its long-term uptrend, line e.
- The volume spike in October 2011 (see circle) was very bullish.
- The weekly OBV has dropped back below its WMA and the uptrend, line d, but did confirm the recent highs.
- The daily studies have moved back above their MAs, which is part of the bottoming process.
- The next major resistance is in the $32-$35 area.
PulteGroup Inc. (PHM) dropped back to test its uptrend (line f) on November 15 as it had a low of $14.55. PHM has since rallied back to initial resistance in the $17 area.
- The drop also tested the former long term resistance, line e, that went back to the 2010 and 2011 highs.
- The daily relative performance did confirm the recent highs but it has since dropped below its WMA.
- The RS line is still holding well above the uptrend, line g.
- The daily OBV has moved back above its WMA as volume has been strong on the recent rally.
- The OBV has held well above its daily uptrend, line h.
- There is minor support at $16.30 and then in the $15.50 area
NEXT PAGE: Two More Homebuilder Stocks Showing Strength
|pagebreak|

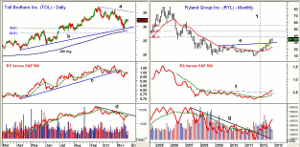
Toll Brothers Inc. (TOL) peaked in September at $37.08 and had a low this month of $28.50; this was a correction of over 23%.
- The chart shows that the rising 200-day MA was tested in November as prices dropped below the 50% Fibonacci support but held above the 61.8% support at $27.62.
- The daily and weekly relative performance did confirm the September highs.
- Currently the RS line is in a short-term downtrend after breaking its uptrend, line c, in early November.
- The daily on-balance volume (OBV) shows a similar pattern as the downtrend, line d, is clearly intact as the OBV has made lower lows.
- There is first support for TOL at $31.50 with further in the $30.60 area.
- There is major resistance and the daily downtrend, line a, in the $35-$36 area.
The long-term monthly chart of the Ryland Group Inc. (RYL) shows how far these stocks have fallen from the highs in 2005-2006 when it traded well over $80 per share.
- The monthly chart shows the completion of a long-term base as resistance from 2008-2009, line e, was overcome in September.
- The monthly lows at $29 and $29.35 now represent important support.
- At the end of January 2012 (line 1) RYL closed above the 20-month EMA and the monthly studies had turned positive.
- The monthly relative performance overcame its long-term resistance, line e, two months ago.
- The weekly RS line (not shown) completed its bottom in early 2012.
- The volume surge in late 2011 pushed the monthly OBV through its long-term downtrend, line g, and it has confirmed the recent highs.
- There is minor support now at $32.80 and then in the $31.60-$32 area.
What it Means: The correction lows in the major US averages have not yet been confirmed but I would not expect XHB or the homebuilders to drop below their mid-November lows. It is also possible that they will hold up even if the overall market corrects.
For new positions a decent retracement of the recent rally will need to be fairly deep as stops need to be placed under the month’s lows.
How to Profit: For SPDR S&P Homebuilders (XHB), go 50% long at $25.64 and 50% long at $24.92 with a stop at $23.84 (risk of approx. 5.7%).
For PulteGroup Inc. (PHM), go 50% long at $15.28 and 50% long at $15.04 with a stop at $14.34 (risk of approx. 5.4%).
For Toll Brothers Inc. (TOL) go 50% long at $30.34 and 50% long at $29.72 with a stop at $28.18 (risk of approx. 6.1%).
For Ryland Group Inc. (RYL) go 50% long at $31.76 and 50% long at $30.68 with a stop at $28.88 (risk of approx. 7.5%).


