Nervous investors took some of the big name Dow Industrial stocks back to more important support in December, and in an analysis of the ten most oversold Dow stocks, Moneyshow’s Tom Aspray has identified some interesting opportunities.
Stocks traded in a fairly narrow range Thursday and the selling was not that heavy. The monthly jobs report today could spur some heavier selling, but I would expect the market to be well supported at lower levels.
Any correction is likely to be over early next week and it should set the stage for a move in the major averages, like the S&P 500, back to the September highs. Therefore any near-term weakness is likely to be a buying opportunity. The action, so far in 2013, increases the odds of a double-digit gain this year.
The monthly starc band analysis of the stocks in the Dow Industrials identifies those stocks that are closest to their starc+ bands (overbought) and those that are closest to their starc- bands (oversold). As I have pointed out in past articles on starc bands, just because a stock or ETF is near its starc- band it does not mean it still cannot go lower. It does indicate that the stock or ETF is at a high risk level to sell and a low risk level to buy.
In last month’s review of the most overbought Dow stocks, I pointed out that Home Depot (HD) had traded near its monthly starc+ band for the past three months. From the December high to low, HD dropped 8.6% before rebounding at the end of the month.
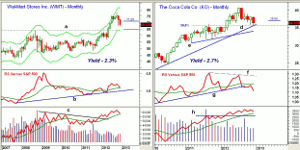
Wal-Mart Stores Inc. (WMT) is the most oversold Dow stock this month as it closed just 6.4% above its monthly starc- band. It has closed lower for the past two months after breaking through ten-year resistance last May. It, along with the other three Dow stocks, look attractive for new purchase at the right price because of their positive monthly analysis.
Chart Analysis: Wal-Mart Stores Inc. (WMT) peaked in October at $77.60 and hit a low last Friday at $67.37, which was a decline of over 13%. The chart reveals that WMT closed above its monthly starc+ band last July and then held firm for several months before correcting.
- There is additional support in the $66.50 area with the quarterly S1 support at $64.50.
- The major breakout level, line a, is at $64 with the monthly starc- band at $63.84.
- The monthly relative performance has just dropped below its WMA but is still above its uptrend.
- This month’s close in the relative performance will therefore be important.
- The monthly OBV is still well above its rising WMA as the OBV staged a major upside breakout in the latter part of 2011.
- There is first resistance at $69.50 with the quarterly pivot at $71.06. A weekly close back above this level would be a positive sign.
The Coca-Cola Co. (KO) peaked in July at $40.55 but then reversed sharply the next month with a recent correction low at $35.58. This was also very close to the 50% Fibonacci retracement support.
- The longer-term uptrend, line d, connects the lows from 2009 and 2010.
- The monthly relative performance did not confirm the highs in July, line f.
- The uptrend in the RS line has been broken and it is well below its flat WMA.
- The monthly OBV looks much stronger as it moved above its WMA in October 2010 and is still positive.
- The weekly OBV (not shown) has turned up but is still below its WMA.
- KO has been strong the first two days of 2013 as it is up 5.6% from the lows.
- The next resistance is at $38-$38.85.
NEXT PAGE: Two More Oversold Dow Stocks |pagebreak|
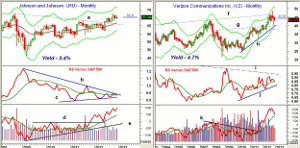
The monthly chart of Johnson and Johnson (JNJ) shows a gradual uptrend for the past two years as the monthly downtrend, line a, was overcome last June.
- JNJ has rallied this week and is currently trading above its quarterly pivot level at $71.06 (blue line on chart).
- There is next resistance at $71.60 and then at $72.74, which was the high in October as well as 2007.
- The monthly relative performance shows a potential bottoming formation as the long-term downtrend, line b, is being tested.
- The RS line shows good support at line c.
- The monthly on-balance volume (OBV) has been much stronger than prices for the past few years after breaking through resistance at line d.
- The breakout level in the OBV was tested in 2012 before the OBV again surged higher.
- There is minor support now at $69.80-$70.20 and then at $69. More important support at $67.80-$68.50.
Verizon Communications Inc. (VZ) spiked above the monthly resistance, line f, in September as it hit a high of $48.77 before the sellers took over.
- VZ was hit hard in October along with most of the high-dividend stocks as it had a low of $40.51. This was a decline of 16.9% from the highs.
- VZ is currently trading above the quarterly pivot at $44.18.
- The converging support, lines g and h, was tested on the recent correction.
- The relative performance or RS line is now testing its rising WMA with more important support at the uptrend, line j.
- The relative performance has long-term resistance at line i.
- The monthly OBV broke through its four-year downtrend, line j, in late 2011.
- The OBV is still acting strong.
- There is initial support now at $43-$43.60 and then at $42.50.
What it Means: The monthly OBV analysis of all four of these stocks indicates they have been undergoing long-term accumulation. All four have good yields, especially when compared to the low yields of Treasury securities. The risk can be well controlled on these stocks if purchases are made at lower levels.
How to Profit: For Wal-Mart Stores Inc. (WMT), go 50% long at $68.34 and 50% long at $67.72, with a stop at $64.36 (risk of approx. 5.4%).
Prior to Wednesday’s opening, I recommended Johnson and Johnson (JNJ), but the buy levels were not hit. Here are the new buy levels. For Johnson and Johnson (JNJ), go 50% long at $70.24 and 50% long at $69.82, with a stop at $67.66 (risk of approx. 3.2%).
For Verizon Communications Inc. (VZ), go 50% long at $43.64 and 50% long at $43.22 with a stop at $41.87 (risk of approx. 3.6%).
Portfolio Update: As per last month’s column, you should be 50% long Coca Cola Co. (KO) at $37.16 and 50% long at $36.70. Use a stop now at $35.34.
To see the current Charts in Play portfolio, click here.


