The much-touted BRICS outperformed the US stock market much of the past decade, but stumbled when the financial crisis hit, but as global economies slowly recover, MoneyShow’s Tom Aspray examines the opportunities based on Brazil’s potential resurgence.
Monday’s stock market decline was the largest of the year and the selling continued in Asia overnight. The resurgence of euro concerns were a good reason for some to take profits, but given the number of Wall Street strategists wanting to buy a pullback, the correction may not last long. The futures are higher before the open.
Some of the European markets were hit the hardest but most have been rising sharply from the mid-November lows. This correction should be a buying opportunity, but it will likely take a bit more time before it is completed.
For a diversified portfolio one should continue to look for opportunities in some of the global markets. One has to consider the economics of the country and most importantly the outlook for their currency as a weak local currency can offset gains for US investors.
For example, the price of the iShares MSCI Brazil Index Fund (EWZ) dropped 2.5% in 2012 as the Brazilian real lost about 5% versus the US dollar. In terms of the local currency, their key market average, the Bovespa, was actually up 7.4%.
Now that China’s economy appears to have turned the corner, many of the other emerging markets have also taken off. Will this be the year that the Brazilian stock market is again one of the world’s top performers?
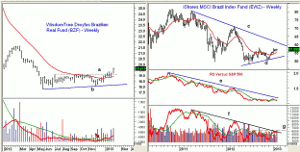
Chart Analysis: The WisdomTree Brazilian Real (BZF) is $60 million dollar ETF that trades 36k shares a day with an expense ratio of 0.45%. It seeks to achieve the same total return as money market rates in Brazil and changes in the Brazilian real versus the US dollar.
- The weekly chart shows the sharp drop in BZF early in 2012 before it developed a trading range, lines a and b.
- BZF has been declining since July of 2011 when it peaked at $29.94.
- Over the past four weeks, the resistance at $19.10 has been overcome several times but last week’s close looks like a convincing breakout.
- This suggests a move to the $21 area with the 38.2% Fibonacci retracement resistance at $22.45.
- The weekly on-balance volume (OBV) dropped below its WMA in September 2011 but now appears to have completed its bottom formation.
- There is minor support now at $19.35 and then at $19 with the quarterly pivot at $18.69.
The iShares MSCI Brazil Index Fund (EWZ) has assets of $9.3 billion and yields 2.84%. The top ten holdings account for 46.3% of it assets.
- In early 2012, EWZ had a high of $70.74 but hit $81.77 in 2010.
- The weekly chart shows a slight uptrend, line b, from the early 2012 lows.
- The weekly downtrend, line c, is now at $61.25.
- The relative performance shows a well established downtrend, line e, consistent with its weaker performance than the S&P 500.
- The RS line has just dropped back below its WMA and a bottom has not been confirmed.
- The weekly downtrend in the OBV, line f, was just broken last week.
- The OBV needs to move strongly above the July highs (line g) to complete a bottom.
- There is initial support at $55.80 to $54.81, which is the quarterly pivot.
NEXT PAGE: A Small-Cap Bet
|pagebreak|The Market Vectors Brazil Small-Cap (BRF) has assets of $550 million with a yield of 1.46% and an average volume of 176k. It has 31.5% of its assets in the top ten holdings and has a total of 74 holdings.
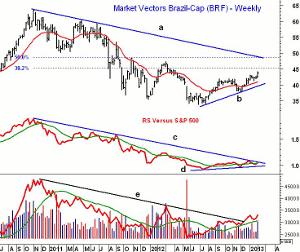
- The weekly chart of BRF shows a much stronger uptrend than EWZ as it closed last week at its best level since last April.
- The 38.2% Fibonacci retracement resistance from the October 2010 high of $63.78 is at $45.18.
- The weekly downtrend and the 50% resistance are now at $48.74.
- The relative performance closed last week above its WMA and completed its bottom in December.
- The RS line has resistance now at the downtrend, line c.
- The OBV broke it downtrend, line e, in December and has turned up from its WMA.
- With Monday’s weak close, the next support is at $42.80 and then more important at $41.80 to $41.34 the quarterly pivot.
What it Means: The technical outlook for the WisdomTree Brazilian Real (BZF) and the Brazilian real futures is positive. This should be supportive for long positions in the Brazil ETFs as it is important for US investors to assess the currency risk before buying global ETFs.
The Market Vectors Brazil Small-Cap (BRF) looks the best technically but could decline a bit more over the near term. This should be a buying opportunity.
How to Profit: For the Market Vectors Brazil Small-Cap (BRF), go 50% long at $43.06 and 50% long at $42.12, with a stop at $39.91 (risk of approx. 6.1%).
Editor’s Note: If you’d like to learn more about technical analysis, attend Tom Aspray’s workshop at The Trader’s Expo New York, February 17-19. You can sign up here, it’s free.


