Given the S&P 500’s impressive gains so far this year, it is not surprising that there are quite a few overbought stocks. But the weekly analysis, says MoneyShow’s Tom Aspray, allows one to identify those that should be sold and those to buy on a correction.
Asian stocks rebounded impressively Tuesday, and the S&P futures closed Monday at 1,547.50, well above the overnight lows of 1,529.50. The major European markets are a bit lower as the concerns over banks closing in Cyprus continue to unsettle the market. The US stock index futures are a bit higher.
Most of the daily technical studies have turned lower. The Spyder Trust's (SPY) second lower close has taken the market averages closer to their next support. However, it will take a stronger decline and a much weaker close to suggest that the market is more vulnerable.
As I discussed last week, you should have an exit strategy in place.
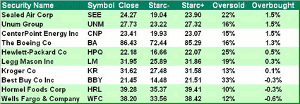
The weekly Starc band analysis of the stocks in the S&P 500 identifies those that are closest to their Starc+ bands (overbought) and those who are nearest to the Starc- bands (oversold). Some of the most overbought stocks are also the market leaders, and should be stocks to watch on a correction.
The first seven stocks on the list are above their weekly Starc+ bands. While that does not mean they can’t go higher, they are a high-risk buy at current levels.
At the top of the list is Sealed Air (SEE) which closed last week 1.5% above its Starc+ band. It was down 1% in Monday’s session. The second stock on the portfolio, Unum (UNM), is one of the holdings in the Charts in Play Portfolio, although further profits were taken recently
Two of the best-known overbought stocks on the list look less positive based on their weekly technical readings. Holders of these stocks should take some profits now.
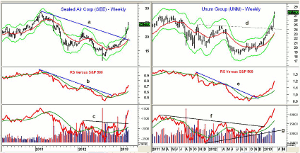
Chart Analysis: Sealed Air (SEE) is a $4.67 billion container and packing company that has risen from an August low of $11.15 to last week’s high of $25.08.
- The high in February 2011 was $28.77. The stock reached a high in 2007 of $38.77.
- The relative performance broke its downtrend in early November, as it had started a new uptrend.
- The RS line has turned up sharply in the past two weeks.
- The weekly OBV moved through its resistance (line c) in February, which confirmed the break of the downtrend.
- There is initial support for SEE at $22.80, with the monthly pivot at $21.43.
Unum (UNM) is a $5.85 billion accident and health insurance company that was recommended just before Christmas in 5 More Stocks For Your Stocking.
- UNM dropped to test its rising 20-week WMA in late December before turning higher and eventually overcoming the resistance at $24 (line d)
- It also closed 1.5% above its weekly Starc+ band. The stock's all-time high is $29.86.
- The weekly relative performance broke its downtrend in late October, giving an advance sign that it was going to become a market leader.
- Since the November low, UNM is up 45%, versus just a 16% gain in the SPY.
- The weekly OBV formed a bullish divergence between December 2011 and July 2012 (line g), which was confirmed by the break through its downtrend (line f).
- The daily OBV (not shown) is still positive.
- There is first support now at $25.40 to $26, and then stronger levels around $23.50.
NEXT: What to Do with 2 Better-Known, Larger-Cap Stocks
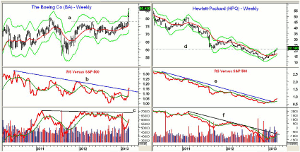
|pagebreak|Boeing (BA) has surged 11.8% in the past two weeks, as the stock moved above the resistance at $78 (line a), then cleared five-year resistance in the $80 area.
- There is further resistance from 2008 at $88.40. The all-time high is $107.15.
- The relative performance broke through its resistance (line b) just last week, and is also not above its WMA.
- The weekly on-balance volume (OBV) is still below the long-term resistance (line c), but is now above its WMA. Therefore, the OBV is acting weaker than prices.
- The volume on the sell side was heavy early in the year.
- The weekly chart has first good support now in the $79 to $81.40 area.
Hewlett-Packard (HPQ) has been one of the big surprises of 2013, up 60% so far this year. HPQ has now reached a zone of resistance from 2011 in the $21.40 to $25.50 area.
- In 2012, HPQ reached a high of $30. Going back to 2010, the stock hit a high of $54.75.
- The downtrend in the relative performance that goes back to 2010 was overcome in February.
- The RS line will take a few months before it can develop a strong uptrend.
- The weekly OBV moved above its WMA in the middle of January, and has just broken its downtrend.
- For HPQ, there is first support at $19.80 to $21, with the monthly pivot at $18.81.
What it Means: Both Sealed Air (SEE) and Unum (UNM) look strong from a long-term perspective, while the technical studies on Boeing (BA) make me more cautious. Hewlett-Packard (HPQ) may be forming a major low, but the monthly studies have not yet completed their bottom formations. Therefore, I would suggest that holders of BA and HPQ take some profits on their positions.
I will be watching for a retracement in Sealed Air (SEE) to establish long positions. Have been taking profits on the position in Unum (UNM) and will consider buying again on a correction.
How to Profit: No new recommendation.
Portfolio Update: Investors should be long Unum (UNM) from $21.01. We sold one-third of the position recently at $26.92, and part of the position was also sold at $23.06.


