Although it takes a lot of practice before one becomes adept at recognizing chart patterns, MoneyShow’s Tom Aspray notes that it’s important to learn how to recognize this particular pattern because it frequently has long-term implications.
The big news over the weekend was AT&T Inc.’s (T) acquisition of DirecTV (DTV) for $49 billion. Though deals of this size are often a plus for the stock market, so far it is not impressed as the futures are showing solid losses in early trading.
There were some signs last Thursday of panic selling, but the rebound late Friday was not strong enough to make one confident that the correction was over. The market needs to continue higher early this week on strong positive market internals to suggest that last Thursday’s low was significant.
As I reviewed in Friday’s Week Ahead column, there have been some additional signs of deterioration in the technical outlook that need to be reversed if the S&P 500 and Dow Industrials are going avoid a drop back to the lower boundaries of their trading ranges.
In reviewing charts over the weekend, I found three stocks that had completed head-and-shoulder top formations. These formations should be understood by both investors and traders as sometimes they can have important long-term implications. For example, the DJ Home Construction Index (DJUSHB) completed a weekly H&S top in May 2006 and did not make its low until early 2009.
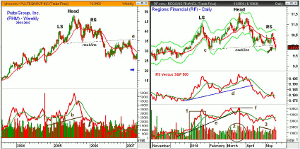
Chart Analysis: The weekly chart of PulteGroup, Inc. (PHM) from 2004-2007 provides a good example of the common characteristics of a head-and-shoulder top.
- PHM had a strong rally from the October 2004 low to the March 2005 high.
- The stock rose from a low of $24.28 to a high of $39.89 as the left shoulder (LS) was forming.
- On this rally, the weekly volume peaked at 26 million shares.
- This is in contrast to the volume of 11 million shares when PHM was making its all-time high in July 2005.
- This, it turned out, was the head of the H&S top formation.
- PHM dropped to a low of $34.25 in October, which matched the April 2005 low.
- This then formed a potential neckline and became key support, line a.
- PHM rallied back to $43.76 in December 2005 on even lower volume (see arrow).
- The weekly OBV had already broken its support as the right shoulder (RS) was forming.
- On Friday May 19, 2005, PHM closed the week below its neckline, which projected a drop to the $20 area.
- Four weeks after the drop, PHM began a seven-month rally into early 2007 before its decline resumed.
- The projected target was hit in August 2007 with PHM eventually making a low of $3.29 in October 2011.
Regions Financial (RF) rallied from a December low of $9.38 to a high of $11.08 in January as the daily starc+ band was tested.
- The volume was heavy on this rally as noted by the boxed in area (point 1).
- RF then dropped to a low of $9.75 before it turned higher, finally reaching a high of $11.54 in March.
- The volume was significantly lower on this rally as the circled area (point 2) indicates.
- The decline from the head held just above the early February low.
- The uptrend in the relative performance, line d, was broken on this decline.
- The RS line continued to deteriorate as the right shoulder (RS) was formed.
- The OBV broke its uptrend (line e) as the head was being formed.
- As the RS was being formed, the volume was even lower than at the head (line 3).
- The neckline of the H&S top, line c, was broken on Friday’s close as volume was increasing.
- The difference between the head and neckline is $11.54-$9.88 = $1.66.
- Therefore, subtracting $1.66 from the neckline gives you a downside target at $8.22.
NEXT PAGE: 2 More Stocks with H&S Top Formations
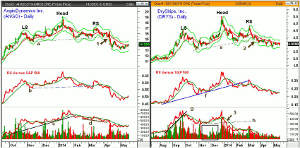
|pagebreak|AngioDynamics Inc. (ANGO) is a small-cap medical instrument company that rallied sharply last fall, rising from a low of $10.84 to a high of $16.20 as the daily starc+ band was tested.
- The decline from this high held at $14.55 which then became good support.
- On January 10, ANGO surged to a high of $19, and though there was one day of high volume, the cumulative volume going into the high was less than it was in October.
- After moving above the starc+ band on the high, prices reversed to the downside the next day.
- The low on this decline was $15.01, allowing one to determine a level of support, line a.
- In the middle of March, ANGO made a low volume high of $17.01, which I have labeled as the RS.
- The drop on April 10 violated the neckline (line a) and volume did increase.
- The relative performance had already broken its support, line b, in early March.
- The daily on-balance volume (OBV) broke its uptrend in early February.
- The OBV the formed a series of lower lows, line d.
- The measurement from the head to the neckline is $19-14.84 or $4.16.
- Subtracting $4.16 from the neckline at $15.32 (its level when it was broken) gives you a projected target at $11.16.
DryShips, Inc. (DRYS) is a $1.25 billion Greek shipping company that reports earnings this week. The stock rallied sharply last August and September, moving from a low of $1.87 to $4.00.
- After exceeding its starc+ band, DRYS retreated for the next four weeks.
- DRYS eventually hit a low of $2.48 before turning higher.
- At the end of December, the stock surged to a high $4.69 before reversing.
- The volume in November and December (highlighted) was quite lower than it was in August and September.
- The decline from the December high bottomed in early February at $2.95, line e.
- The relative performance broke its support, line f, on this decline.
- The OBV also broke its support, line h, on this correction (point 3).
- As DRYS rebounded to the early March high of $4.10 (RS), the volume remained low.
- The neckline support (line e) was broken on March 24.
- The difference from the head to the neckline was ($5.00-2.95) of $2.05.
- Measuring down once the neckline was broken gave you a target at $1.32.
What It Means: The H&S top formation is an important chart formation for technical analysts to understand as is the reverse H&S formation, which is an important bottom formation. Volume plays an important role in both formations as it should be the heaviest at the LS and then lower at the head and RS. Ideally, volume will increase when the neckline is broken.
It would take a close above the RS to invalidate the formation.
As was the case with PulteGroup, Inc. (PHM), the projections from these formations can often be exceeded by a wide margin. I plan on doing an update on these stocks in the coming months.
How to Profit: No new recommendation


