One of the last year’s worst-performing sectors has turned out to be one of this year’s best performers, and MoneyShow’s Tom Aspray takes a technical look at several stocks in this group that are being accumulated..
Asian markets responded positively to both the strong close in the US markets last Friday, as well as positive economic data out of China and Japan. Exports in China were surprisingly strong while the Japanese government raised its 1st quarter GDP from 5.9% to 6.7%. Some were looking for a downward revision.
The stock market’s strong performance last week confirmed the positive signs from the technical studies that have been pointing higher for several weeks. As noted on Friday, the market is getting overextended on a short-term basis and a pullback could actually improve the technical outlook.
This could take the Spyder Trust (SPY) back to the $193.25-$194 area, which would be a 1-1.5% correction from current levels. In my review of 4 of the Year's Best Sector ETFs, I took a look at those ETFs, which had outperformed the SPY by 2.6% to over 8%, so far in 2014.
The materials sector was not far behind, and even though some questioned its upside breakout in February, it has now been confirmed. The Select Sector SPDR Materials (XLB) has gained over 4.5% in the past month and is close to our next upside target. Though there are a number of stocks in this sector that flashed positive volume signals last week, they have not yet broken out with the rest of the market but are being accumulated.
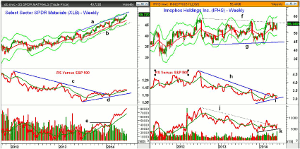
Chart Analysis: The Select Sector SPDR Materials (XLB) had a great May as it was up close to 3% and has also been very strong in June.
- The weekly chart shows trend line resistance in the $50.38 area with the weekly starc + band at $50.78.
- The quarterly projected pivot resistance is at $51.45 or 3.4% above current levels.
- The relative performance broke its downtrend, line c, but has only been in a shallow uptrend so far in 2014.
- The RS line has key support at line d.
- The weekly OBV has been much stronger as it staged an impressive move through resistance, line e, in February.
- It has continued to act much stronger than prices.
- The daily OBV (not shown) has also confirmed the new price highs.
- There is initial support at $48.90-$49.25 with the monthly pivot at $48.49.
Innophos Holdings Inc. (IPHS) is a $1.2 billion specialty chemical company that yields 2.8% and is 5% below its 52-week high.
- The weekly chart shows a broad trading range, lines a and b, that has been in effect since early 2012.
- A strong close above $57 would be an upside breakout with targets in the $67-$69 area.
- The weekly starc+ band is at $59 with the quarterly projected resistance at $65.58.
- The relative performance broke its downtrend, line h, in early 2014.
- The RS line shows a pattern of higher lows and needs a move above the recent high to complete its bottom formation.
- The OBV pulled back after breaking through resistance, line j.
- It has turned higher from support at line k, and gave an AOT buy signal last week.
- There is initial support now at $54.30 with stronger at $53-53.70.
NEXT PAGE: 2 More Materials Stocks Under Accumulation
|pagebreak|Vulcan Materials (VMC) is an $8.3 billion dollar building materials company that is trading 8.6% below its 52-week high.
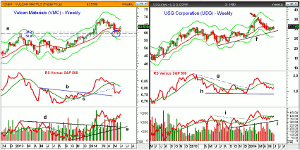
- The stock made a high of $69.50 in March and dropped below the 38.2% Fibonacci support three weeks ago.
- The early 2013 high and the breakout level at $59.29 (line a) was also tested.
- The 50% retracement support level is at $57.73.
- The relative performance broke its downtrend, line b, early in the year.
- The RS line did confirm the highs before breaking its uptrend, line c.
- The OBV also staged an impressive breakout early in the year as strong resistance (line d) was overcome.
- The OBV moved back above its WMA in mid-May and has turned up after holding above its WMA.
- The monthly pivot resistance is at $65.07 and then further resistance is at $66.08, which was the early May high.
- There is minor support now at $62.40 with the rising 20-day EMA at $61.70.
USG Corporation (USG) is a $4.29 billion building materials company providing products for both residential and non-residential construction. It is down just over 14% from its 52-week high.
- The chart shows that it surged to a new high at $36.20 in late February as it reached its starc+ band.
- The long-term support at line f was just recently tested as it had a low of $28.57.
- The close last week was above the highs of the prior five weeks.
- The quarterly pivot is at $32.42 with the weekly starc+ band at $34.57.
- The relative performance broke its downtrend, line g, and its WMA early in the year.
- The RS line has turned up but is still below its WMA.
- The on-balance volume (OBV) staged a similar breakout in January as resistance at line i was overcome.
- The OBV held above support (line j) on the recent correction and has moved back above its WMA.
- There is initial support now in the $30.60-$30.90 area with the 20-day EMA at $30.25.
What It Means: In this current environment, the risk is too high in buying the Spyder Trust (SPY) or PowerShares QQQ Trust (QQQ), but there are a number of stocks each week that appear to have completed their corrections.
Focusing on the long-term charts like last week’s focus on the monthly charts of Dow stocks can help you identify the risk on each position, which is essential in this market.
As the economy continues to improve, these three stocks will benefit from a surge in construction spending.
How to Profit: For Innophos Holdings Inc. (IPHS), go 50% long at $54.47 and 50% long at $53.68, with a stop at $51.48 (risk of 4.8%).
For Vulcan Materials (VMC), go 50% long at $62.77 and 50% long at $61.88, with a stop at $59.13 (risk of 5.1%).
For USG Corporation (USG), go 50% long at $30.96 and 50% long at $30.44, with a stop at $29.21 (risk of 4.9%).


