Big-cap stocks were in the news yesterday as several reported earnings disappointments, so MoneyShow’s Tom Aspray studies the charts of three of these giants to see what the recent declines will mean for their stock prices in the months ahead.
In Tuesday’s comments, I noted that the market internals were not as strong as prices Monday, but that was not the case on Tuesday as 2615 stocks advanced with just 583 declining. This was the type of strength the market needed to signal that last week’s lows should hold. The strong surge in the McClellan oscillator is a sign of strength as the bullish divergence was confirmed last Friday (see chart).
The Dow Transportations led the way gaining amongst the major averages closing up over 3%. The iShares Dow Jones Transportation (IYT) is now trading well above its quarterly pivot—that I discussed yesterday—so Friday’s close will be important.
The Nasdaq 100 was up 2.62% with the Philadelphia Semiconductor index up 3.61% and the iShares Nasdaq Biotechnology (IBB) gaining 3.22%. Most of the major averages and strong sectors have now reached more important resistance indicating that now is not the time to chase the market.
The big-cap stocks were in the news yesterday as McDonald’s (MCD), International Business Machines (IBM), and Coca-Cola (KO) have had earnings disappointments. These stocks have bombed with KO down over 6% Tuesday on 56 million shares.
Though the month is not over yet, a look at the monthly charts of these three big-cap giants can help us determine what the recent declines mean for their stock prices in the months ahead.
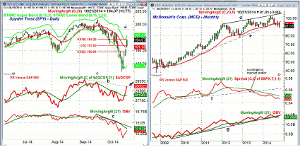
Chart Analysis: The Spyder Trust (SPY) came very close to the 61.8% Fibonacci retracement resistance at $194.26 as the high was $194.20.
- The daily starc+ band is at $195.82 with longer-term resistance at $198, line a.
- There is minor support at $192.50 with the 20-day EMA at $191.38.
- There is more important support at $188.47, which was last Friday’s close.
- The S&P 500 A/D line closed Tuesday above the bearish divergence resistance at line b.
- As I commented last week, this is a sign that the correction is now over.
- The A/D line could pullback to its WMA as part of the bottoming process.
- The daily on-balance volume (OBV) is still lagging the price action as it is below its declining WMA.
The monthly technical outlook for McDonald’s Corp. (MCD) has been negative since August as the long-term support, line e, was broken.
- MCD is now 12.3% below its 52-week high and is down 3.7% YTD.
- There is support now at $89.34, which has been the low this month.
- The quarterly projected pivot support is at $85.34.
- The monthly relative performance violated its support, line f, in July 2013.
- This indicated that MCD was no longer a market leader.
- MCD did mange to make a new all time high in 2014 before dropping sharply.
- The monthly OBV dropped below its support, line g, in July and is also below its WMA.
- The 20-day EMA is now at $92.28, which represents first resistance.
- The quarterly pivot stands at $95.28 and represents more important resistance.
NEXT PAGE: Two More Big-Caps to Watch
|pagebreak|
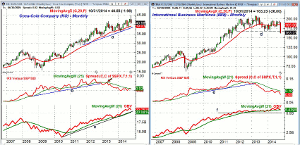
Coca-Cola Company (KO) shot up to a high of $44.87 on October 10 but closed Tuesday at $40.68 after its poor earnings and weakening guidance.
- KO is now down 9.34% from its 52-week high and is up just 0.69% YTD.
- The rising 20-month EMA is at $39.03 with the August low at $38.78.
- The uptrend from the 2011 lows is now in the $38 area.
- The monthly RS line made a new high in July 2012 but then broke its uptrend, line b, at the end of 2012.
- The RS line tested its flattening WMA in April (see arrow) and has stayed below its declining WMA ever since.
- The monthly OBV is still holding well above its support, line c.
- The OBV did confirm September’s closing high.
- The weekly OBV (not shown) is still holding above its rising WMA.
- There is now gap resistance in the $41.19 to $42.31 area.
International Business Machines (IBM) closed last Friday at $182.05 and opened Monday at $166.85 and lost another 3.47% in Tuesday’s session.
- IBM is now down 18% from its 52-week high of $199.21 and is down 11.3% YTD.
- Over the past three years, it is down 1.4%.
- The monthly chart shows that IBM is currently trading below the major support at line d.
- A monthly close below this level will project a decline to the $125-$130 area.
- The monthly relative performance began a new downtrend in October 2012.
- The RS has continued to stay below its WMA and made a series of lower lows.
- The monthly OBV made a new high in 2014 but looks ready to close the month below its WMA.
- There is more important OBV support at line f.
- The weekly OBV is well below its declining WMA and is currently also below the June lows.
What it Means: Given the action this week in some of the big-cap stocks, many are wondering which will be next. Boeing (BA) beat estimates as it released its earnings before the open today. Also out today is AT&T (T), with Microsoft, Inc. (MSFT), 3M Co. (MMM) and Caterpillar (CAT) reporting on Thursday.
It will be important to watch which stocks and ETFs (see table) close the week above or below their quarterly pivot levels. All three of these big-cap stocks are currently trading below their quarterly pivots.
How To Profit: Now new recommendation.


