
The weekly scan of the Nasdaq 100 revealed seven stocks that closed last week above their weekly starc+ band, so MoneyShow's Tom Aspray takes a technical look to determine if any can still be market leaders heading into the New Year.
The stock market has not yet had its normal November market correction, and this week, the typical seasonal pattern starts to improve. Though Friday's close below the day's highs dampened some of the bullish enthusiasm, the market tone last week was clearly positive.
The EuroZone markets are higher again early Monday and the US futures are also well in positive territory ahead of the opening. As reviewed in the Week Ahead column, there are still a number of signs that the market averages are still in a high risk zone.
This is especially true of the market tracking ETFs like the PowerShares QQQ Trust (QQQ), which is my favorite from a relative performance and volume perspective. The failure to pay attention to risk can be the difference between a winning and losing portfolio.
Click to Enlarge
If you wanted to buy the QQQ on Friday's close at $103.87, the safest place to put your stop would be under $99, which is risk of 4.6%. Now that may not seem too bad, unless you understand that the QQQ closed the week just 1.6% below its starc+ band and is 8.5% above the strac- band.
The starc band analysis easily allows for a drop in the QQQ
back to the $100-101 area without changing its positive trend. The weekly
starc band scan of the Nasdaq 100 revealed seven stocks that closed the
week above their weekly starc+ band. Does that mean they can still be market
leaders as we head into 2015?
Click to Enlarge
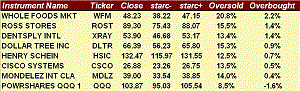
Chart Analysis: Whole Foods Market (WFM) was hit hard early in the year as its earnings were much weaker than expected.
- WFM is up over 27% in the past three months, but is still down 15.5% YTD.
- The weekly chart shows next strong resistance in the $50 area, line a.
- WFM closed 2.2% above its weekly starc+ band (see table) on Friday for the third week in a row.
- The relative performance broke its downtrend, line b, in early October, two weeks before it surged to the upside.
- The weekly OBV moved back above its WMA in August and continued to rise as prices moved higher.
- This was consistent with accumulation as the OBV is now reaching strong resistance at line c.
- The 20-day EMA is now at $45.11 with the December pivot a bit higher.
Ross Stores Inc. (ROST) was up 7.3% in Friday's session as it posted a 16% in year over year earnings. Their earnings report beat expectations on many fronts.
- The stock is up over 29% in the past three months and closed last week 1.4% above its weekly starc+ band.
- The weekly trend line resistance (line d) is now in the $90.60 area.
- The weekly RS line has broken its long-term downtrend, line e, confirming it is a market leader.
- It moved above the early 2014 highs in August completing the bottom formation.
- The weekly on-balance volume (OBV) has been very strong since it moved above resistance at line f, in mid-September.
- The daily OBV is also up sharply and confirming the price action.
- The tentative monthly pivot for December is at $86.11 with the 20-day EMA
at $81.81.
NEXT PAGE: Two More Stocks to Watch
|pagebreak|
Click to Enlarge
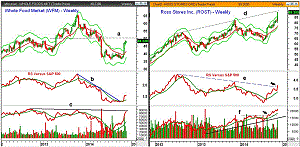
Cisco Systems (CSCO) closed last week above the highs from August 2013, line a. It closed right on the quarterly projected pivot resistance at $26.84.
- The completion of the continuation pattern, lines a and b, has upside targets in the $31-$33 area.
- The relative performance is still locked in its trading range, lines c and d.
- Therefore, CSCO is not yet confirmed as a market leading stock.
- The weekly OBV does look better as it has moved above the resistance from 2011, line e.
- The daily RS and OBV analysis are positive with both now confirming the price action.
- There is minor support now in the $25.50-$26 area, which included the early October highs.
- The rising 20-week EMA is at $24.76.
Mondelez International (MDLZ) is a manufacturer of confectionary products that were formerly the snack and food brands of Kraft.
- The strong support in the $32 area, line f, was tested at the October lows.
- MDLZ has now rallied back to the July high of $39.37.
- The quarterly projected pivot resistance is at $41.29.
- The weekly RS line has moved back above its WMA but has just reached the former support, now resistance, at line g.
- The daily relative performance (not shown) does look more positive.
- The weekly OBV has bounced from support at line h and has moved back above its WMA.
- It is still well below the highs from early in the year.
- There is first good support is in the $35.50-$36.90 area.
What it Means: The weekly technical picture for all of the stocks, except Mondelez International (MDLZ), does indicate that they can continue to be market leaders as we head into 2015.
All will require a pullback of 5-10% from their recent highs to allow a good risk reward entry point.
Whole Foods Market (WFM)
and Ross Stores Inc. (ROST)
are the most overextended currently but also look the most positive.
How to Profit: No new recommendation.
Here are some of my recent articles that you might enjoy:
Four
IBD Top 50 Stocks on the Way Up
Demand
Success from Your Portfolio
Best
Charts from Successful Investing's Top 14 Picks


