The commodity markets are notorious for their wide swings, so MoneyShow’s Tom Aspray reviews a unique commodity indicator to see if crude oil can still go higher and whether this creates an opportunity in the energy sector.
The stock market was firing on all cylinders Thursday as investors shrugged off the weaker than expected Retail Sales report to push the major averages close to their previous record highs. The German Dax had its eleventh record high close for the year.
The better than expected EuroZone GDP report this morning has continued to push their markets higher in early trading Friday. There also seemed to be some progress in the discussions between Greece and the EuroZone finance ministers to resolve the Greek debt problem.
The NYSE Composite, Spyder Trust (SPY), and Powershares QQQ Trust (QQQ) have completed their two month trading ranges. The market internals were better than 3-1 positive as the NYSE Advance/Decline Line made another new high. The Nasdaq 100 and S&P 500 A/D lines have turned up sharply but have not yet made new highs.
Crude oil underwent a sharp two day slide early in the week as the selling increased after a government report stated supplies had reached an eighty year high. Many, therefore, concluded that crude oil had resumed its downward slide.
Therefore, Thursday’s gain of almost 5% caught many by surprise. The energy sector has stabilized while crude oil has moved higher. The SPDR Oil & Gas Exploration & Production (XOP), a popular energy ETF, is up 8.5% in 2015 as this sector has clearly been supportive for the stock market. But XOP is still down 13.5% over the past three months.
The money flow analysis on crude oil turned positive on February 2 for the first time since September 29. This warned of the impending rally as those who were short crude oil were forced to cover. So, does this indicator now favor even higher crude oil prices or is the rebound over?
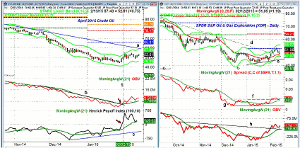
Chart Analysis: The April Crude Oil opened the week at $53.05, but dropped to a low of $48.93 on Wednesday.
- After Thursday’s sharp gains, crude oil is up almost $1 in early Friday trading.
- The recent rebound high is at $55.05 with the daily starc+ band at $57.97.
- The daily downtrend, line a, is now in the $60 area with the quarterly pivot at $65.81.
- The daily OBV broke its downtrend, line b, at the start of the month and it is holding above its WMA.
- The weekly OBV (not shown) closed above its WMA last week, which may be part of the bottoming process.
- The Herrick Payoff Index (HPI) rose to +160 on February 2, (line 1).
- The HPI has just turned up from its rising WMA and still acts positive.
- There is short-term support now at $50 with the daily starc- band at $46.13.
The SPDR Oil & Gas Exploration (XOP) has total assets of $2.61 billion with a yield of 1.46%. The expense ratio is 0.35% and there are 80 holdings in the ETF, with just over 16% in the top ten holdings.
- The daily downtrend in XOP, line d, was broken on February 3.
- On Monday, XOP hit a high of $53.56, which was just above the quarterly pivot at $53.03.
- The daily starc+ band is at $55.97 with further resistance at $57.50.
- The daily relative performance completed a short-term bottom formation as it has moved just above the resistance at line f.
- The weekly RS line (not shown) is now just slightly above its declining WMA.
- The daily OBV broke through its resistance, line h, at the start of February.
- The weekly OBV needs a positive close (above $51.99) to stay above its WMA.
- The monthly studies are still clearly negative.
- The rising 20-day EMA is at $48.95 with the daily starc- band at $47.07.
What it Means: The technical action in crude oil suggests it can move higher and I would not be surprised to see the April contract test the $56-$58 area. Before a long-term bottom is complete, I would expect a drop back towards the old lows, but I am not expecting to see significant new lows.
Though SPDR Oil & Gas Exploration (XOP) may be completing a long-term bottom, the negative monthly technical studies suggest a patient approach for investors. For traders, we may get a short-term opportunity in the next week or so.
Other sector ETFs, like the Market Vectors Semiconductor (SMH) that I discussed Wednesday do look more attractive right now.
How to Profit: No new recommendation.


