Two European-focused ETFs have recently completed their weekly bottom formations, so MoneyShow's Tom Aspray analyzes their charts to see if now is the time to add global diversification to your portfolio.
Last week’s broadly based stock market rally was not enough to convince the stock market skeptics that stocks could go even higher this year. It is also likely that many individual investors are still on the sidelines as they worry about the health of the economy and the prospect for higher rates.
On a short-term basis, the US market appears ready for a short-term pullback when trading resumes on Tuesday. Technically, it looks like a correction over the near term will set the stage for a decisive move above last week’s highs.
Given the 24-hour news cycle, stock market investors always have something to worry about. But as I discussed in Friday’s Will Stocks Melt Up? there are also reasons why stocks could go much higher before the summer.
The broadly based STOXX Europe 600 hit a seven year high on Friday but is a bit lower early Monday ahead of the negotiations by the EuroZone finance ministers over Greece’s debt deal.
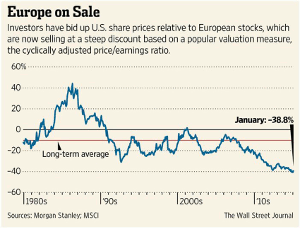
I continue to think that stocks are the best place to be, and since last summer, have thought that the EuroZone economies will be a positive force in 2015. A recent WSJ article focused on how European stocks are trading at a steep discount “based on the cyclically adjusted price/earnings ratio—a valuation measure popularized by Nobel Prize-winning economist Robert Shiller.”
This valuation analysis is more relevant now as these two European-focused ETFs have recently completed their weekly bottom formations, consistent with significantly higher prices in 2015.
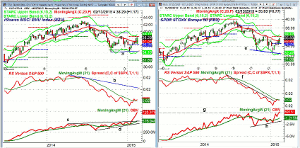
Chart Analysis: The iShares MSCI EMU Index (EZU) has total assets of $7.93 billion with an expense ratio of 0.48%. There are 236 stocks in the ETF with just 24.6% in the top ten holdings and a yield of 2.94%.
- The weekly chart shows that EZU peaked at $43.04 in early June.
- EZU was down 9.87% in 2014 but is up 8.19% in the past month.
- The low so far in 2015 has been $34.51, which was a decline of 19.8% from the 2014 high.
- The ETF is now just below the quarterly pivot resistance at $38.60.
- The weekly relative performance formed a negative divergence, line b, at last summer’s high.
- The RS line has moved slightly above its WMA, consistent with a bottom.
- The weekly OBV stayed strong during the decline in 2014.
- The OBV staged a strong upside breakout three weeks ago as resistance at line c, was overcome.
- There is initial support at $37.67 with the rising 20-day EMA at $37.19.
- The quarterly pivot is at $36.38.
The SPDR STOXX Europe 50 (FEU) is a large-cap ETF with total assets of $238 million and an expense ratio of 0.29%. It has a yield of 5.90% with 39.24% in the top ten holdings.
- The ETF formed lower lows, line e, in early 2014.
- It was down 8.25% in 2014 but is up 7.24% in the past month.
- FEU closed above the quarterly pivot at $34.60 just two weeks ago.
- The quarterly pivot resistance is at $36.17 with the starc+ band at $36.50.
- The weekly RS line has broken its steep downtrend, line f, and is just barely above its WMA.
- The weekly on-balance volume (OBV) formed a bullish divergence, line h, at the recent lows.
- This divergence was confirmed when the OBV moved above resistance at line h, last week.
- The rising 20-day EMA is now at $34.95 with further support in the $34 area.
- The 2015 low was $32.58 and the weekly starc- band is at $32.47.
What it Means: Neither of these ETFs hedge their exposure to the euro while the WisdomTree Europe Hedged Equity Fund (HEDJ) does hedge its euro exposure and has done much better in the past year.
Since most investors have a dollar denominated portfolio in stocks or bonds, I prefer these two ETFs for added diversification through their euro exposure. The weak euro clearly helps the EuroZone exports, and of course, the euro will not decline forever.
Of the two, SPDR STOXX Europe 50 (FEU) looks the strongest technically, while the greater number of holdings in iShares MSCI EMU Index (EZU) gives one added diversification. Both require a pullback to provide a good risk/reward entry.
How to Profit: For the iShares MSCI EMU Index (EZU) go 50% long at $36.44 and 50% at $35.77 with a stop at $34.29 (risk of approx. 5%).
For the SPDR STOXX Europe 50 (FEU) go 50% long at $34.72 and 50% at $33.92 with a stop at $32.37 (risk of approx. 5.6%).


