Though IBD’s Top 50 list generally includes some top performers, a number of them are often the most volatile, so MoneyShow’s Tom Aspray studies the charts of two hit the hardest and two that have been immune to the selling to see if they are poised to be leaders once the correction is over.
The stock market selling was broadly based on Tuesday with the down volume swamping the up volume by a seven-to-one margin. The mid-cap S&P 400 was down 1.33% with the small-cap S&P 600 losing 1.25%. Both were better than the 1.70% decline in the S&P 500, while the iShares US Home Construction index (ITB) was only down 1.08%. It closed just above last week’s recommended buying level.
The Spyder Trust (SPY) has reached next support in the $205 area with the monthly projected pivot support at $201.60. There is first resistance now in the $206.90-$207 area. The NYSE ARMs Index closed Tuesday at 2.64 and is oversold but still below the 3.61 reading on January 28. The McClellan oscillator is still declining and is now at -192.
The sharp decline in the EuroZone markets has taken the SPDR STOXX Europe 50 (FEU) to the initial buy zone as the quarterly pivot level was tested. The EuroZone markets are showing nice gains in early trading with the German Dax up 1.75%. The STOXX Europe 50 is up 1.6%. The S&P futures are also trading higher but a strong close is needed to signal a further rebound.
Of course, many of the high flying momentum stocks have been hit the hardest and several of the Investor’s Business Daily Top 50 stocks are down double digits in just the past few weeks. Two other Top 50 stocks have been immune to the selling and should be leaders once the correction is over.
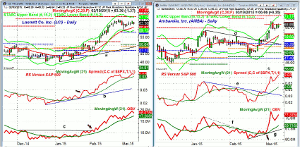
Chart Analysis: Lannett Co. Inc. (LCI) is a $2.27 billion company that manufactures, markets, and distributes generic drugs. It was up 29.55% in 2014 and has been acting strong so far in 2015.
- The late February high at $65.69 was not far below the quarterly projected pivot resistance at $67.51.
- The daily chart shows that LCI has been moving higher in the past week as the market has moved lower.
- The 20-day EMA is at $60.97 with the monthly pivot at $58.18.
- The projected monthly pivot support is at $50.64 with the daily uptrend, line a, just below $50.
- The daily relative performance bottomed at the end of January.
- The RS line has made further new highs this week and is well above its WMA.
- The daily OBV broke through resistance, line c, at the start of February and has since been rising sharply.
- The OBV did make a new high this week and the weekly OBV is equally strong.
- The weekly starc+ band is at $69.73.
Ambarella, Inc. (AMBA) is a $2.0 billion developer of semiconductors to process high definition video. It was up 49.66% in 2014 and has already gained 13.15% in 2015.
- AMBA peaked in early January and then corrected into the latter part of February.
- The correction was completed by the break of the downtrend, line d.
- AMBA quickly rallied back to the monthly pivot resistance while the quarterly resistance is at $71.77.
- This also corresponds to the daily starc+ band with the weekly at $72.54.
- The RS line confirmed the price action by also breaking its downtrend, line e.
- This confirmed that AMBA was a market leader.
- The volume has been strong on the rally with over four times the average volume traded on March 4.
- The OBV moved through its downtrend, line f, in the middle of February.
- It continues to look very strong and the weekly OBV has also made a new high.
- There is short-term support now at $63.20 and the January high.
- The rising 20-day EMA and stronger support is now at $60.30.
Next: Two More of IBD’s Top 50 Stocks to Watch
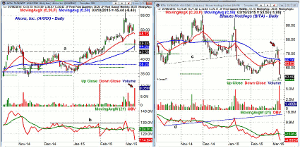
|pagebreak|Akorn Inc. (AKRX) is a $4.9 billion manufacturer and marketer of diagnostic and therapeutic ophthalmic pharmaceuticals. It was up 47.03% in 2014.
- The stock spiked to a high of $55.86 on February 27 but is now down 18.65% from this high.
- The chart shows that the rising 50-day MA was violated on Tuesday.
- There is further chart support now in the $42.50 area, line a.
- The volume of over nine million shares Tuesday was over four times the daily average.
- The daily OBV did not confirm the recent highs as it was just barely able to move above the resistance at line b.
- The OBV dropped back below its WMA two days after the high.
- The weekly OBV (not shown) did confirm the recent highs and looks much stronger.
- There is first resistance at $47.50 with the 20-day EMA at $48.72.
Bitauto Holdings (BITA) is a Chinese provider of Internet automobile content and marketing services. The stock was up 120.31% in 2014 but is 44% below its January high of $95.
- The January high took BITA just above the declining 50-day MA (in blue).
- The daily chart shows that it broke daily support, line c, on January 13.
- The February rally took BITA back to this resistance before it again turned lower.
- The volatility has been extreme as BITA hit a high of $74.80 four days ago but closed Tuesday at $53.50.
- The volume Monday of 5.6 million shares was five times the average.
- The daily OBV broke support at line d in early December.
- This OBV resistance was just tested during January’s rally, which was a sign of weakness.
- The daily OBV shows a clear pattern of lower highs and lower lows.
- There is first resistance now at $59-$60 with the 20-day EMA at $63.03.
What it Means: The Top 50 list from IBD generally includes some of the stock market’s top performers but these stocks are often some of the most volatile, especially in a down market. This makes them difficult for investors but traders also can have trouble limiting the risk. This can make them better option candidates since the risk can be limited.
I would expect Lannett Co. Inc. (LCI) to lead the market higher but it is not clear yet that the correction from the February highs is over. The best stop would be under $50, which makes the risk too high at current levels.
A drop in Ambarella, Inc. (AMBA) back towards the 20-day EMA at $60.30 would likely create a good buying opportunity but a stop under $55.68 would mean the risk was over 8%.
I will be watching these two to see if I see a better risk/reward entry.
How to Profit: No new recommendation.


