The sharp drop in biotechnology stocks has some investors worried, but MoneyShow’s Tom Aspray reviews the technical and seasonal data to develop a strategy for a leading biotech ETF as well as two leading biotech stocks.
The market croaked Wednesday as the very weak Durable Goods report gave investors more reasons to sell. The biotech and semiconductors bore the brunt of the selling as both were down over 4% on the day. The market internals were 3-1 negative but not bad enough to suggest that the selling is over.
A weaker than expected final reading on 4th quarter GDP Friday could give investors more reason to sell. This week will add a few more bricks to the wall of worry that I discussed in Friday’s Why Building the Wall of Worry Is Bullish. Wide swings in the Durable Goods are common as it was down 3.7% in December but up 2.8% in January, so the 1.4% drop in January is not a reason to turn negative on the economy.
So, what’s next? The S&P futures are down again in early trading as they are getting closer to next support in the 2020 area. Many are watching the March lows so they may need to be broken before the pullback is over. The new weekly highs in the NYSE A/D line do not yet warn of a major correction as I noted in Tell Tale Signs of a Correction. The daily A/D lines are at or below their WMAs with key support at the February lows.
The biotech stocks are now getting much of the attention as some are wondering if the multi-year run in this market leading group is over. In 2014, the biotech stocks topped in February and the ensuing decline shook many out of this volatile sector before a 70% rally.
So, what about this year? How far will a leading biotech ETF drop and how long will the decline last? Let’s take a look.
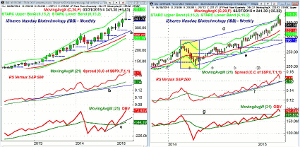
Chart Analysis: The monthly chart of iShares Nasdaq Biotechnology (IBB) shows a potential reversal in March after it reached a high of $374.97, which was just below the starc+ band at $381.58.
- The monthly support from February is now at $305.
- The uptrend that goes back to the early 2014 lows, line a, is now at $279.
- The rising 20-month EMA is at $266.05.
- Based on current data, the 2nd quarter pivot will be $338.
- The monthly relative performance looks ready to make a new high again in March.
- The RS line has been in a strong uptrend since early 2013 and is well above its rising WMA.
- The monthly OBV dropped below its WMA in December before surging to the upside.
- The OBV will make a new high with a higher close in March.
- The OBV has good support now at line c.
On the weekly chart of iShares Nasdaq Biotechnology (IBB) I have highlighted the correction that occurred in 2014.
- This correction lasted eight weeks as it dropped IBB 24.6% from its high.
- The correction low in 2015 occurred on April15.
- IBB came close to its weekly starc- band on several occasions.
- The seasonal tendency is for biotech to top out in January and then bottom on June 20.
- The rising 20-week EMA is at $322.18 with the weekly starc- band at $310.99.
- This zone is a likely downside target with more important support in the $290-$300 area.
- The upper trading channel (line d) and starc+ band were tested two weeks ago.
- The weekly RS line has turned lower but did make a new high with prices.
- The RS line has good support at the uptrend, line f, and its WMA.
- The weekly OBV broke through resistance, line g, at the end of February.
- There is resistance now in the $355-$360 area.
Next: Two More Biotech Stocks to Watch
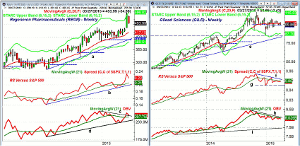
|pagebreak|Regeneron Pharmaceuticals (REGN) moved above its WMA two weeks ago before reversing this week.
- There is next support in the $437 area with the rising 20-week EMA at $417.19.
- The uptrend from the 2014 lows, line a, is in the $390 area.
- The weekly starc- band is now at $380.51.
- The weekly relative performance did confirm the recent highs and is well above support at line b.
- The RS analysis of REGN was featured in last week’s trading lesson.
- The weekly OBV broke its downtrend, line c, three weeks ago, but it did not confirm the recent highs.
- There is initial resistance now in the $470-$475 area.
Gilead Sciences (GILD) held up better than most biotech stocks on Wednesday as it was down just 1.55%.
- The weekly chart shows a narrow range recently as the quarterly pivot at $99.01 is being tested.
- A weekly close under $95.81 is likely to trigger heavier selling.
- The weekly starc- band is at $87.70 with the uptrend just below $85.
- The weekly RS line has formed lower highs, line f, as it has been diverging from prices.
- The RS line has important support now at line g, which, if broken, would be negative.
- The weekly on-balance volume (OBV) formed a negative divergence, line h, at the October high.
- It shows a pattern of lower highs as it has stayed below its WMA.
- There is long-term OBV support at line 1.
- There is first resistance now at $105.71 and a close above $108 would be positive.
What it Means: I would look for the correction in iShares Nasdaq Biotechnology (IBB) to be shorter than it was in 2014, maybe only six weeks.
Would look for signs of a panic low in the $318-$322 area but it could get down to $310.
For Regeneron Pharmaceuticals (REGN), the support in the $420-$425 area is likely to hold, which is over 6% below current levels. I would not want to see a close below $383.
I expect the selling to increase in Gilead Sciences (GILD) before the correction in the biotech sector is over. This is because of the weak readings of the technical studies as it has not been a market leader since December. Celgene Corp (CELG) and Illumina, Inc. (ILMN) also look vulnerable.
How to Profit: No new recommendation.
Due to unforeseen circumstances, there will not be a Week Ahead column on Friday, March 27, but publication will resume on April 3.
Here are some of Tom’s most popular recent articles:
The Best of Barron's New Year Picks


