Smart investors who took Tom Aspray's advice are now well positioned as stocks have started off the year with a bang. Tom sees more opportunities in the coming weeks, but stresses that buying the strongest stocks or ETFs at good levels will be the best recipe for success in 2013.
Stocks finished 2012 and started off the year on a very strong note, with the Spyder Trust (SPY) gaining over 4% and the Powershares QQQ Trust (QQQ) doing even better. Though the monthly jobs report was a bit weaker than expected, stocks were able to hold their gains into the close on Friday
Pessimism over the economy and the stock market was rampant in the second half of December, as evidence mounted that individuals were avoiding stocks. The technical picture was much different, and the new high in the NYSE Advance/Decline line suggested that “stocks could be the best Christmas gift this year.”
Since the first wave of cliff-related selling reached its peak in mid-November, the technical evidence indicated that the market was just correcting and not forming a major top. The skepticism was easy to understand: the dysfunctional action in the House of Representatives was embarrassing, especially the decision not to vote on Hurricane Sandy relief.
This has been the pattern for the past few years. Do you remember what the sentiment was like in the summer of 2010?
On July 1, 2010, with the S&P 500 at 1,027 and down 15% from the April highs, many were expecting the second half of the year to be even worse. The fears over a default by Greece or Spain and the potential for a double-dip recession led the concerns, as discussed in this article from CNNMoney.
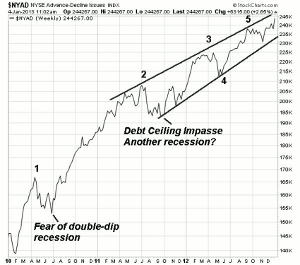
The weekly chart of the NYSE A/D line from Stockcharts shows that the April 2010 highs in the stock market were confirmed by new highs in the A/D line (point 1). This was not consistent with a new bear market. The July 1 lows did hold, and the A/D line signaled that the correction was over in early September.
Just over a year later, the scenario was much the same, as the market had taken a beating over the debt-ceiling impasse in August. By September, the concerns over the health of the global economy and Euro debt crisis had reached a fever pitch. In reaction, the stock market lost $500 billion on Thursday, September 22.
The A/D line was acting much stronger, as it made another new high in early July 2011, confirming a healthy market. The selling climaxed on October 4, and the daily A/D lines on the S&P 500 and Dow Industrials completed their bottom formations on October 13.
The weekly A/D line had again made new highs by early 2012 (point 3) as stocks were up sharply in the first quarter. The sharp correction in May and early June was once again fueled by Euro debt concerns and weakening economic data. The decline helped to validate the conviction that one should “sell in May.”
A review of the historical patterns in presidential election years suggested that maybe 2012 was the year to “buy in May,” as the A/D line had confirmed the market highs in the spring of 2012.
The daily A/D line bottomed in early June (see chart) as the weekly A/D line tested its uptrend (point 4). There were further new highs in September (point 5), and after the drop in November, the A/D line has accelerated to new highs again this week.
NEXT: What to Watch
|pagebreak|I hope these examples will illustrate the power of the A/D line to give you a different picture than is often portrayed in the financial media.
Even though the market is overbought in the short term, and we may see a sharp setback in the next week, it should be a buying opportunity. For the next few months, I expect the stock market to ignore the “wall of worry” over the debt ceiling and related economic headlines and continue to climb higher.
As was the case for much of the fourth quarter, the economic data over the past two weeks has generally been better than most economic forecasters expected. The housing data released Christmas week was quite good, with both new home and pending sales data continuing to improve.
Last week’s data from the Institute for Supply Management (ISM) on both the manufacturing and non-manufacturing front showed improvement. The ISM Manufacturing Index still shows a pattern of lower highs (line a), and needs to move above last April’s high to break out. The ISM Non-Manufacturing Index is on the verge of breaking its downtrend (line b).
This week the economic calendar is very light, with the jobless claims Thursday, followed Friday by the international trade numbers as well as import and export prices. From a global standpoint, we have both the Bank of England and ECB interest rate decisions on Thursday.
What to Watch
The sharply higher gap openings in some of the widely followed ETFs does favor a pullback this week, but I would not expect the gaps to be filled. Though some are worried about the quick move to overbought levels in some of the A/D indicators, it may also be a measure of the market’s strength.
The lows last Monday did hit some of my stops, which apparently were not wide enough for a moderately thin market, but many of my new buy recommendations were also hit. My new buy levels were at good support where the risk could be controlled, as I continue to think that entry levels will be key in 2013.
I would not expect most stocks or ETFs to break last week’s lows, and will be looking for partial setbacks to buy. The small caps did the best last week, as the iShares Russell 2000 Index (IWM) was up over 5.5%. The January Effect seems to be working again this year.
I continue to favor stocks in my four favorite sectors, and also added one new sector last week. The materials are now showing good relative performance.
The individual investor turned a bit more bearish in the past week. The number of bulls dropped 6%. It is still well above the levels seen at either the 2010 or 2011 lows.
There has not been much change from the financial newsletter writers in the past month, as the number of bulls has ranged from a low of 43.6% bullish to 48.9% bullish. This is a sentiment gauge that has had little predictive value in the past year.
The reversal in the VIX was quite dramatic, dropping 37% in just three days. Those who used the VIX to hedge their portfolios because of the fiscal cliff were likely hurt.
NEXT: Stocks and Tom's Outlook
|pagebreak|Stocks
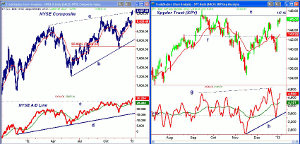
The daily chart of the NYSE Composite shows that the trend line which connects the March and September highs (line a) has been tested this week. The May 2011 high at 8,718 is the next upside target, and it is not far above last Friday’s close.
The NYSE Advance/Decline line was strong last week, as it has clearly surpassed the prior highs (line c). The A/D line did drop below its WMA before the end of the year, but quickly reversed. It has long-term support at line d.
There is initial support for the NYSE Composite sits at 8,500, with the rising 20-day EMA at 8,430. The quarterly pivot is at 8,368, with more important support at last Monday’s low of 8,298.
S&P 500
The Spyder Trust (SPY) gapped higher Wednesday and added to the gains late in the week.
The close was just below minor resistance at $146.52 to $147.16 (line e), with additional levels at the September high of $148.11. There is psychological resistance at $150, followed by the first-quarter R1 pivot resistance at $150.58.
The S&P 500 A/D line surged in December, and is now above the highs from September (line g). It is still below the highs made last spring. There is first support for the A/D line at its WMA, with more important levels at the uptrend (line h).
There is first support for SPY in the $144 area, with the rising 20-day EMA at $143.20, which corresponds to the lower boundary of the gap. There is major support now in the $139 to $140 area.
Dow Industrials
The SPDR Diamond Trust (DIA) was able to overcome the December highs at $133.73, but is still well below the October highs at $135.77 to $136.44. Some of the Dow stocks have reached oversold levels based on monthly Starc band analysis, and are looking interesting on a pullback.
There is initial support now at $132.20 to $133 with more important levels at the quarterly pivot at $131.46.
The Dow Industrial A/D line (not shown) has been able to move above the April-May highs, which is bullish for large-cap stocks, as it is acting stronger than prices.
Nasdaq-100
The PowerShares QQQ Trust (QQQ) was able to surpass the December highs last week, but like the DIA is still lagging the other market average ETFs. The next strong resistance is at $68.30 and then at the early October highs of $69.80.
The Nasdaq-100 A/D line was stronger than prices in December, as it made new rally highs before reversing sharply into the end of the month. It closed the week above its WMA and support (line c).
There is initial support now at $65.50 to $66.11 and the quarterly pivot. There is key support now in the $63.50to $64 area.
Russell 2000
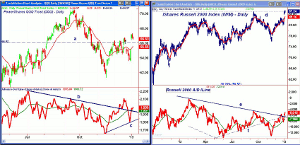
The iShares Russell 2000 Index (IWM) closed above the September 2012 as well as the May 2011 highs last week. The quarterly R1 resistance is now at $90.45.
Two weeks ago, the Russell 2000 A/D line was able to move through the bearish divergence resistance that went back to the February highs. The A/D line retested the rising WMA last week before moving above the prior highs. This creates a bullish zig-zag formation.
There is first support for IWM at $84.70 to $85.20 and then in the $82.50 to $83 area.
NEXT: Sector Focus, Commodities, and Tom's Outlook
|pagebreak|Sector Focus
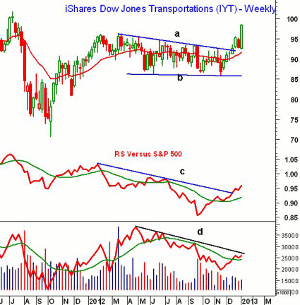
The iShares Dow Jones Transportation (IYT) was up even more last week than IWM, gaining close to 6%.
The weekly chart shows the very strong breakout from the trading range (lines a and b) that was formed during most of 2012. There were signs before the holidays that this lagging sector was catching up, and as I noted then, this was a positive sign for the overall market in 2013.
The weekly and daily relative performance analysis have completed their bottom formations, as the yearlong resistance (line c) has been overcome. The weekly OBV has moved back above its WMA for the first time since June, with next resistance at line d.
There is minor support now at $96 to $96.60, with stronger levels to follow at $94.50.
All of the secrtor ETFs had great gains last week, led by the Select Sector SPDR Energy (XLE), Select Sector SPDR Financial (XLF), and Select Sector SPDR Industrials (XLI),which were all up over 5%.
The Select Sector SPDR Consumer Discretionary (XLY) was not far behind, gaining 4.7%, as did the Select Sector SPDR Materials (XLB).
The Select Sector SPDR Technology (XLK) wasup over 4%. The weakest were the Select Sector SPDR Utilities (XLU), Select Sector SPDR Consumer Staples (XLP), and Select Sector SPDR Health Care (XLV),all up around 3.5%.
Crude Oil
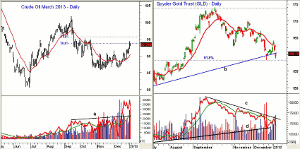
The March crude oil contract gained over $2 last week despite concerns over low demand. The technical picture appear to be telling a different story, as the 50% Fibonacci retracement resistance has been overcome. The 61.8% resistance is at $95.70, which if surpassed will signal a move back to the $100 level.
The OBV surged strongly in December, confirming the price action, as it overcame the resistance (line a).
Precious Metals
The metals had a wild ride last week. After surging on Wednesday, they quickly reversed to close the week near the lows.
GLD closed below the daily uptrend (line b) and is just barely holding above the 61.8% support at $158.10. The OBV still looks weak, as its downtrend (line c) is still intact. It will be important to see whether the OBV can hold above its lows and the uptrend (line d) this week.
The Week Ahead
Hopefully some of you took my recommendations to get invested in the stock market in the past month. Even a more conservative approach like equity income funds or closed-end small-cap funds I liked last month have done well.
If not, there will be additional opportunities, but the risk will be a bit higher. Don't chase the market—but do develop a plan for new buying.
There are likely to be further opportunities in the coming weeks and some of the high-dividend stocks that also have growth potential are one place to look. This would include some of the Dow stocks I recently recommended.
I am still looking for a deeper correction to get more involved in the overseas markets, but there will be opportunities in the coming months. The long-term outlook for gold still looks positive, but the short-term action does not favor buying now.
Those who have 401ks should think about analyzing your funds. As I explained last year, this is a good time to get well positioned for 2013.
Don't forget to read Tom's latest Trading Lesson, The Most Powerful Pivot Level
