Lots of analysts will say that November through May is the best time to be in stocks, but the market can still have gyrations, so MoneyShow’s Tom Aspray takes to the charts to determine if it’s a good time to be an aggressive new buyer.
The stock market’s powerful rally from the October lows has definitely impressed most professional analysts and the financial media. Some commentators that were recommending the short side of the market in October, are now back in the bullish camp.
Others, when asked if they have changed their view, point to their macro view of why the liquidity-driven economy and the stock market can’t continue to stay strong for much longer. Of course, these macro views may be right at some point but those hedge funds that follow a macro strategy have had a dismal year. One $15 billion fund was down 11% by the middle of October and many have lost money so far in 2014.
As I mentioned in July’s One Bubble Starting to Burst, I felt that decision by Calpers (California Public Employees' Retirement System) to change its hedge fund strategy was the start of the hedge fund bubble bursting. Their announcement—on September 15—that they were terminating their $4.5 billion hedge portfolio provided confirmation. Don’t get me wrong, as many are run by very smart guys and some are doing quite well, but still, their exponential growth couldn’t last.
The exit polls after the big Republican win suggested that the general public was pretty pessimistic on the economy and the surging stock market was not helping them become more hopeful or optimistic about the future.
The public participation in the stock market is still at very low levels as the crash of 2008 and the financial scandals have kept them away. Even the strong jobs report last Friday is unlikely to encourage new investments by those who are worried about their jobs and haven’t gotten a raise.
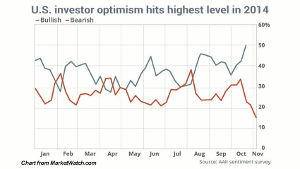
The recent volatility also has probably discouraged other new investors. Meanwhile, those that are investing have become much more bullish. Last Thursday’s poll of individual investors from AAII revealed that only 15.05% are now bearish. Looking back, I believe that is the lowest reading since July 2005. The bullish percentage rose further to 52.69%, which is the highest reading since December 26, 2013.
Though this is far from a perfect indicator, the very low bullish readings in 2010 and 2011 helped confirm good buying opportunities. Even though the extremes in sentiment often lead prices by several weeks, this is the first reason why I think a new investor should not jump into the market right now. In contrast, at the February 2014 panic lows, over 36% were bearish.
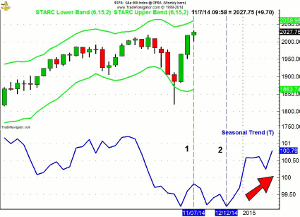
The second reason that I feel now is not a good time to be an aggressive new buyer is because of the market’s seasonal tendency over the next month. There have been many articles about how November-May is the best time to be in stocks and the third year of a president’s term is the best for the stock market. That may indeed be the case by May, or at the end of 2015, but that does not mean that, in the interim, the market can’t have more severe gyrations.
The seasonal analysis of the S&P 500—that uses data going back to 1930—reveals that the stock market typically tops on out November 7 (line 1). It then declines for two weeks before a brief rebound. On a seasonal basis, it finally bottoms on December 13 (line 2) and rises until the spring.
In my analysis, I found the seasonal analysis to be the most effective when it is in agreement with the charts and technical studies. There are many instances where a market is entering a seasonally strong period but it looks very weak technically.
For example, we are getting close to the strongest seasonal period for crude oil, yet the technical outlook across many time frames looks negative as I discussed in last week’s Two Worst Markets in Any Time Frame. So, for crude oil, I will be waiting for some positive signals before I pay attention to the positive seasonal bias.
There are some worrisome signs for the stock market now on a technical basis and the view from last week’s column was that an even stronger rally was needed to overcome some of the divergences.
NEXT PAGE: What to Watch
|pagebreak|In Friday’s review of the Dow Jones Averages, I pointed out that both the Transports and Utilities had reached or exceeded their weekly starc+ bands. This does not mean they cannot continue to move higher but does indicate that they are now both in high risk buy areas.
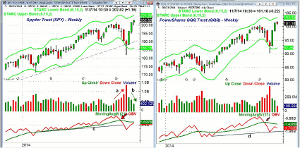
The weekly chart of the Spyder Trust (SPY) shows that it is currently just about 1.5% below its weekly starc+ band as it had dropped well below the starc- band in October. The volume on the October decline was quite heavy, line a, and reached climax levels the week of October 17.
The volume on the rally has been quite disappointing as the histogram shows a series of lower highs, line b. The on-balance volume (OBV) generally does a much better job of identifying whether the buyers or sellers are in charge.
The fact that the weekly OBV dropped below its WMA and support (line c) on the correction was a sign of weakness. Now it has just rallied back to its WMA, which is a reason for caution. This could be resolved positively by another higher close on good volume this week that could move the OBV back above its WMA. However, a lower close could turn the pattern more negative.
The market leading PowerShares QQQ Trust (QQQ) shows a similar pattern, though it lagged some last week and may form a doji. This would make last week’s low at $102.03 more important. The volume and OBV patterns for the QQQ are very similar to that of the SPY, with important OBV support now at line d.
In last week’s full economic calendar, the outlook on manufacturing was mixed, with the PMI Manufacturing Index weaker than expected while the ISM Manufacturing Index was quite strong as new orders were up nicely. Factory orders were pretty much flat.
The economic calendar is light this week with Veteran’s Day on Tuesday when the stock and futures markets are open but the bond market is closed. After Thursday’s jobless claims, we have Retail Sales and the mid-month reading on Consumer Sentiment from the University of Michigan.
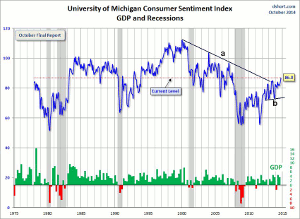
At the end of October, Consumer Sentiment rose to a new bull market high of 86.9. On the great chart from Doug Short, I have drawn the downtrend, line a. In 2013, I noted that it was broken, which I felt at the time was a positive sign for the economy. A drop below the key support at line b, would be quite negative, but given the many positive signs for the economy, that does not look likely.
What to Watch
It was another strong week for the stock market in spite of a few earning’s misses that dropped some stocks very sharply. Still, there were plenty of winners as the technology, health care, industrials, and consumer staples all made new highs last week.
The sharpness of the rally makes identifying short-term support difficult as the first levels to watch are at the November 4 low. A break below these levels should signal a decline at least to the 20-day EMAs, if not the quarterly pivots.
Though buying a market-tracking ETF like the SPY or QQQ is high risk at current levels, there are some stocks that are just coming off support and look good technically. At the end of October, I ran a scan of the small-cap S&P 600 for those stocks that had positive monthly and weekly volume. Some were recommended last week in 4 Small-Caps with Bullish Monthly Volume.
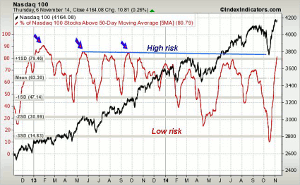
Some measures of the market are already reaching overbought levels, which also makes the risk high at current levels. The 5-day MA of the number of Nasdaq 100 stocks above their 50-day MAs has now risen to 80.79% after dropping to 9.70% on October 17.
It is now over one standard deviation above the mean at 63.30%. It peaked above 80% several times in 2013 (see arrows) and is now in a high risk area. The divergences in the weekly OBV for all the major market index ETFs is still the primary concern as is the lagging action of the NYSE Composite.
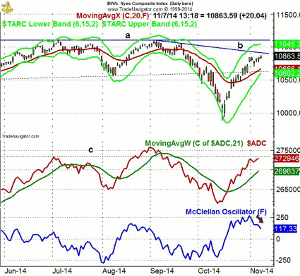
The daily chart of the NYSE Composite (NYA) is still below the short-term downtrend, line b, which is now at 10,900. There is further resistance at the July highs, line a. The NYSE dropped below its quarterly quarter pivot at 10,789 last week but bounced back above it by the end of the week.
The daily starc+ band is at 11,045 with the weekly starc+ band just a bit higher at 11,108. The quarterly projected pivot resistance is at 11,340.
The rising 20-day EMA is now at 10,666 with the quarterly projected pivot support at 10,470.
The daily NYSE Advance/Decline line has moved back to the late June highs, but is still well below the August highs as is the NYSE Composite.
The McClellan oscillator peaked at +269 on October 31 and has since declined. It is now just above the +100 level. There is further support at the zero line.
NEXT PAGE: Stocks
|pagebreak|S&P 500
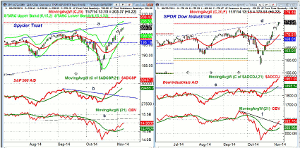
The Spyder Trust (SPY) dropped to a low of $200.06 last Tuesday, but then made higher highs the next three days to close near the best levels of the week. The weekly and daily starc+ bands are now in the $206-$206.50 area with the quarterly projected pivot resistance at $208.43.
The daily S&P 500 A/D line has continued to make higher highs and shows a bullish pattern. It is well above its rising WMA and has been very strong since it broke through its downtrend, line b.
The daily on-balance volume (OBV) moved a bit higher last week, but is still well below the resistance from August and September, line c.
Once below the $200 level there is further support at $198.50 with the 20-day EMA at $198.65. The quarterly pivot is at $196.19 with the monthly pivot at $195.13.
Dow Industrials
The SPDR Dow Industrials (DIA) just reached the trendline resistance, line d, in the $175.50 area. The daily starc+ band is at $177.54 with the weekly at $177.32. The quarterly pivot resistance is at $179.48.
The daily Dow Industrials A/D line made further new highs last week and has moved well above the September highs (line e).
The daily OBV has finally broken its downtrend, but is still well below the September highs.
There is initial chart support now at $172.46 with the rising 20-day EMA at $170.50. The quarterly pivot and more important support is at $168.61.
Nasdaq 100
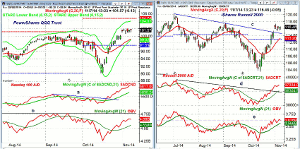
The daily chart of the PowerShares QQQ Trust (QQQ) was pretty much unchanged last week as it did form a doji. On a weekly closing basis, last week’s low at $100.67 now becomes more important. A close this week below it will trigger a low close doji sell signal.
The daily starc+ band is at $103.99 with the quarterly projected pivot resistance at $104.74.
The daily starc- band is at $98 with the 20-day EMA at $99.25. The quarterly pivot is at $97.59 with the 20-week EMA at $96.69.
The daily Nasdaq 100 A/D line continued to make new highs last week and is acting stronger than prices. It is well above its strongly rising WMA and a pullback to this support should be a buying opportunity.
The daily OBV is also well above its rising WMA and made a new high last week. It is still well below the all time highs at line b.
Russell 2000
The iShares Russell 2000 Index (IWM) gapped above its daily downtrend, line c, last week, which is a bullish sign. The quarterly projected pivot resistance at $116.58 was exceeded last week. The daily starc+ band is at $119.73 with the monthly pivot resistance at $121.27.
The daily Russell 2000 A/D has continued to move higher last week and has now exceeded the early September high. It is well above its rising WMA.
The daily OBV has just moved barely above the September highs, line e. It is getting closer to the July highs and a move above this resistance would be a very positive sign.
There is minor support now at $115.28 and then further in the $114 area. The 20-day EMA is now rising more sharply and is now at $113.18.
NEXT PAGE: Sector Focus, Commodities, and Tom's Outlook
|pagebreak|Sector Focus
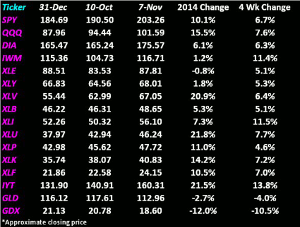
The iShares Dow Jones Transportation (IYT) is now up over 21% for the year. As I reviewed last Friday, the technical studies are positive but it has reached stronger resistance.
Both the weekly and daily OBV continue to make new highs and the relative performance analysis signals that IYT is still a market leader.
It has been an impressive past month as, in addition to IYT, the Select Sector Health Care (XLV) and Select Sector Utilities (XLU) are up over 21% for the year.
For the year, the PowerShares QQQ Trust (QQQ) is still up 15.5% for the year with the Spyder Trust (SPY) up just over 10% for the year.
The Select Sector Technology (XLK) is up 14% with the Select Sector Financial (XLF) not too far behind as it is up 10.5%.
The SPDR Dow Industrials (DIA) continues to try and catch up and the relative performance analysis may be forming a bottom. It is up 6.1% for the year.
Interest Rates
The yield on the 10-Year T-Note declined last week closing at 2.312. It is still well above the panic lows from mid-October when it closed at 2.199% but dropped well below 2.00% for a short period of time on October 15.
The long-term chart still shows a potential bottom formation as the multi-year downtrend, line a, was broken in 2013. This downtrend and the uptrend from the 2013 lows, line b, are now in the 2.00-2.10% area.
The Week Ahead
The stock market was able to maintain its gains last week and rallied sharply in the last 30 minutes of trading. Still, it continues to look a bit tired as there is some deterioration in the short-term technical indicators like the McClellan oscillator. This continues to allow for a correction before the Thanksgiving Day holiday.
Now that we have the election behind us, it will be interesting to see if the market turns lower and, if so, what level of selling that we will see. Some of the sentiment numbers suggest that we need to have a sharp but brief market drop, which will cause some to reconsider their commitment to the stock market.
If crude has another sharp drop in the next few weeks, it will likely put further pressure on the stock market.
Investors who are long in some of the well diversified ETFs that I previously recommended, such as Vanguard FTSE Europe (VGK), Vanguard FTSE Pacific (VPL), and Vanguard Large Cap ETF (VV) should stick with them.
The same goes for the Vanguard FTSE Emerging Markets ETF (VWO) that I recommended last August (A Contrary Bet for 2014?)
For those trading the indices, I would not be adding new positions and the same goes for most of the sector ETFs. There are likely to be some stocks that will buck the trend and I am looking at the small-cap consumer discretionary stocks with Retail Sales data on Friday.
Be sure to monitor my Twitter feed for up-to-date changes in the market outlook as well as recommendations before the opening.
Don't forget to read Tom's latest Trading Lesson, Demand Success from Your Portfolio.

