Given that the market internals are deteriorating, options expert Lawrence McMillan of McMillan Analysis Corporation takes a look at the charts to determine the course of action for option traders.
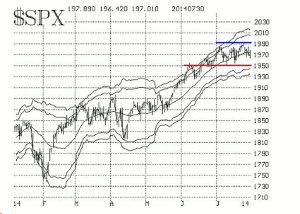
Wednesday was a volatile day, with prices swinging back and forth several times during the day. However, by the time that the dust settled, SPX was virtually unchanged. This is typical of the way that the market has been behaving recently. In fact, if one takes a “neutral” look at the SPX chart, it is possible to see a trading range, between roughly 1950 and 1980, over the past month. Yes, there were marginal new highs during that time, but SPX has pulled back within the range over the past week. Moreover, overnight prices are much lower. S&P futures were down about 10 points (for reasons that are not clear, but seem to have something to do with the Fed’s statements Wednesday), and then jobless claims Thursday morning sent the futures down another six points. This will push SPX below 1960 and may set up another test of the 1950 soon.
Equity-only put-call ratios remain on sell signals. Ironically, their sell signals initially occurred in early July—just about the time that the current trading range began (see SPX chart). So, while it is clear that these have not been effective put-call ratio sell signals so far, it is interesting to note that the market has been unable to make any headway while they have been in effect.
Market breadth was poor on the NYSE Wednesday, but much better in stocks only terms (because NASDAQ and small-cap breadth was quite positive—an internally bullish factor that isn’t getting much attention yet). In any case, both breadth oscillators are in negative territory, reflecting the continuing general weakness of the market internals.
Volatility indices were little changed Wednesday, but were poised to open higher Thursday. An uptrend is beginning to develop in VIX, as the 20-day moving average is rising, and there is a series of higher lows in place. A close above 13.80 would be another higher close (albeit not as high as the spike of two weeks ago). That would definitely put VIX in a higher trending mode, and that is the first time that I would say that VIX is now moving into an area where it is bearish for stocks.
In summary, the internals are deteriorating, and now, apparently, so is the price of SPX. A close below 1945 would violate the support area, and would change the picture to intermediate-term bearish. We will wait for that before acting, though.
By Lawrence McMillan, Founder and President, McMillan Analysis Corporation


