
Matt McKinney, of Zaner Group, takes a technical look at the chart for gold and thinks good options plays might be to buy calls or bull call spreads with a put for a hedge (or insurance) in case the trend changes to down dramatically.
After going on a complete tear higher, Comex gold settles down a bit.
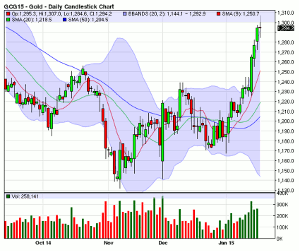
Fundamentally, after rallying to high for this move last Thursday (1-21-15, 11:07AM) at about $1307/ounce, the market seems to be very oversold to me. Although we haven't taken out the previous high of about $1347/ounce back in the week of July 11 earlier this year. Some experts are saying this is just your "run of the mill" rally that can occur at the start of the year. Personally, I believe—with what happened to the Swiss franc as it made about a 30 thousand dollar move in one day in the futures market, some recent choppy trading in the equity markets, and crude prices that have nosed dived—maybe this rally in gold could be much more. We'll have to what and see.
Technically, I have added my favorite technical indicators to the gold chart below. They are the 9 (red line), 20 (green line), and the 50 (blue line) period simple moving averages or SMAs. I have also added Bollinger Bands or BBs (the light blue shaded area) and Candlesticks (the red and green bars). On the daily chart below, each bar or Candlestick represents one day of trading. These few technical indicators tell me 6-12 different characteristics about the market at a quick glance. I have them saved on my charts so they can populate any chart, any market, and any time frame at the click of a mouse.
Also, from a technical standpoint, this is a big bullish breakout on both charts in my view. We also have what I have coined a "Super-Trend" up on both charts. In order to achieve this, what we need to have happen first is a cross of the 9 period SMA (red line) up and over the 20 period SMA (green line) as both indicators point higher on a fairly sharp angle while the market itself trades above the 9. Now we have the 9 period SMA as our first area of support, then the 20, and on the daily chart the 50.
On the daily chart below, I also want to point out that what I like to pay attention to on the Bollinger Bands is not the light blue shaded area itself, but where the light blue area starts at the bottom and then where it ends at the top. So I have four out of five of my indicators pointing up and they are the 50-day, the 20-day, the 9-day, and the top line of the BBs. That is extremely bullish to me, especially when the market is trading not only above the 9 day, but also above the top line of the BBs. This could also indicate an overbought environment in corn. However, even though the market could be do for a correction back to the 9 day SMA or so, markets can remain overbought for long periods of time. At rate I expect higher prices.
I figured this out by pulling up and studying a daily and weekly chart with my indicators by the click of a mouse.
March Daily Gold Chart
Click to Enlarge
Super Trend Simple Moving Average Report:
Option Play:
Some good plays I think could be to buy calls or bull call spreads with a put for a hedge or insurance in case the trend changes to down dramatically. I would recommend this in a 3-to-1 ratio as always. Calls or bull call spreads have a limited risk and unlimited profit potential.
It is also important to note that I am not married to a market, but to trends. So I make recommendations with options on futures and commodities like the energies, metals, currencies, softs, financials, and more.
By Matt McKinney of Zaner Group


