With signs of a bottom now appearing on the charts for coffee futures, Greg Harmon of Dragonfly Capital identifies the confirmation signal he expects will clear the way for a new long position.
It looks like it might be time to start clearing out some room for a long position in coffee. Back in mid March, the story was not so clear and was still biased to the downside. Now, several weeks on, the signs of bottoming are building.
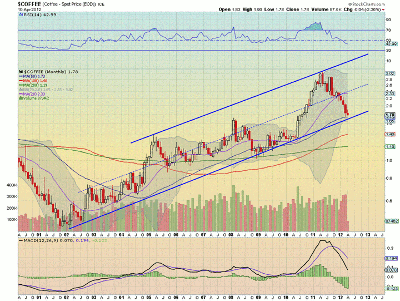
The monthly chart below is only 5% from the channel bottom at $1.69 and the bottom of the Bollinger bands and less than 3% from the 50-month simple moving average (SMA).
With a Relative Strength Index (RSI) verging on crossing into bearish territory and a Moving Average Convergence Divergence (MACD) indicator that is growing increasingly more negative, it could just blow through the channel bottom and look for support around $1.11, so it is not time to buy yet.
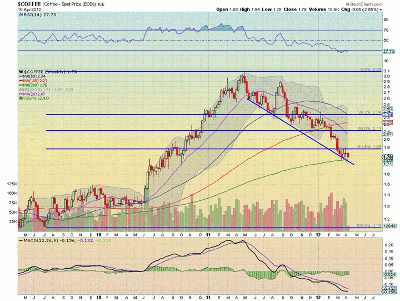
But, the weekly chart is showing signs of consolidation after bouncing on the 200-week SMA a month ago:
The RSI on this time frame is oversold but holding, while the MACD is beginning to trend higher. A move back above $1.88 would confirm a long entry.
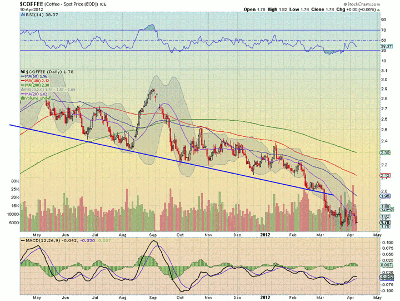
But that is not all. The daily chart is perking up as well:
After breaking the trend line lower, it has been consolidating between $1.76 and $1.88. The RSI is slowly trending higher as well.
Editor’s note: These charts are of spot coffee futures, which may be the best vehicle to trade. Traders who favor ETFs may consider the iPath Coffee Total Return Sub-Index ETN (JO) or the iPath Pure Beta Coffee ETF (CAFE).
By Greg Harmon of Dragonfly Capital


