Tim Bourquin highlights this stock's latest test at longtime resistance, and two ways traders can approach it.
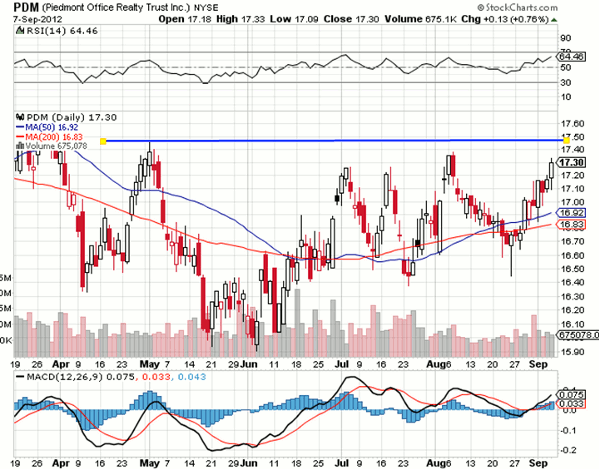
Piedmont Office Realty Trust (PDM) recently crossed above its 200-day moving average, and looks to be testing a price level it previously tested no less than four times since late April.
Here is a recent daily chart:
Traders can look at this in two ways:
- An aggressive trader can short this stock into resistance at around $17.50 if they believe it will, once again, fail to break through that level.
- Breakout traders can wait for a closing daily bar above $17.50 and go long with a stop around $17.25 (depending on your risk tolerances).
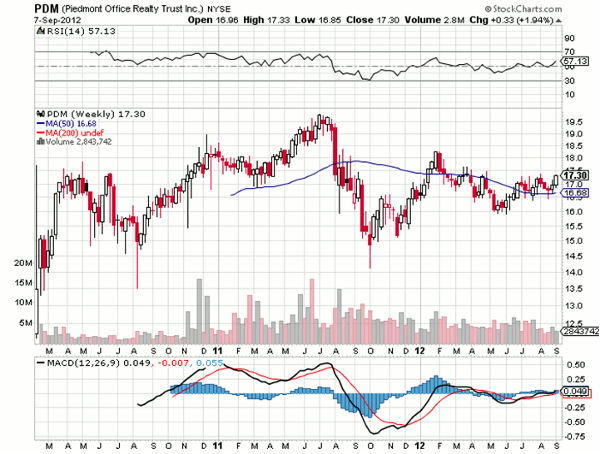
Looking back further on a weekly chart, the previous high of just under $20 will make for the next resistance level.
If it breaks through that as well, the sky is the limit and a trailing stop of around 50 cents would be appropriate.
Tim Bourquin is the co-founder of the Traders Expo and the Forex & Options Expo.


