It appears that there’s a new gold rush going on, but it’s towards the exits, notes technician Greg Harmon of Dragonfly Capital, and the stampede could get worse.
Gold was THE place to be for nearly 12 years. Moving from $250 per ounce to over $1900 per ounce while the stock market gyrated on its seesaw ride. You could not go wrong. Many pundits made an entire career over that stretch. Then something happened. No sooner did it break 1900 with calls for a brazillion dollar target than it went flat line. Tired of running higher. Instead of going up forever, it entered a sideways channel between 1550 and 1800, where it stayed for 18 months. Until Friday.
Subscribers have been hearing about the channel for a long time with the warning that a move under 1550 would change things from neutral to bearish. Well, that warning was accentuated Friday with the first breach of the channel. And the follow through Monday left no time to sit around and ask your friends what to do. This yellow rock is no longer in fashion. It has the plague, AIDS, or leprosy. It is radioactive. People cannot get rid of it fast enough. It may bounce as the daring onlookers touch it, but this has been a very long run higher. It is unlikely that two days is all it takes. So just how low can it go? Lets look at a few different perspectives.
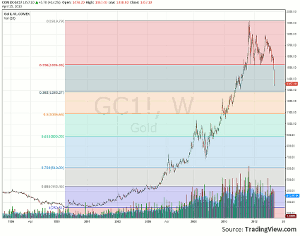
Gold, Fibonacci Retracement
The Fibonacci levels show that the 38.2% retracement of the long trend higher stands at 1283.27. With the recent moves, it could reach that by today. If it fails, 1086 and then 890 are up next. Hard to believe calls for over $2000 recently with that backdrop.
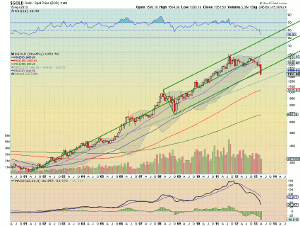
Gold, Andrew’s Pitchfork
The Andrew’s pitchfork applied to gold shows a breach of the lower median Line. That, in itself, does not mean a continued move lower as it will continue to attract it back higher. A break of the dotted line though, the Hagopian trigger Line, at about 1225 would trigger a bearish long-term entry. Good news and bad news. Not there yet but could also fall a lot more before any need to reverse.
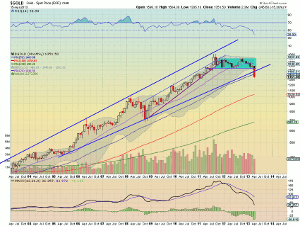
Gold, Trend
The final view, straight trend analysis with support and resistance shows break of the rising trend support and the 50-month SMA. There looks to be some support at 1200 but the 100 month SMA is lower at 1038 and the RSI and MACD are falling like they just discovered gravity. This run lower is not over.
By Greg Harmon of Dragonfly Capital


