The market was volatile leading up to the shortened holiday trading week as technician Corey Rosenbloom of AfraidToTrade.com takes a technical look at five stocks that reached their 52-week highs.
A quick mid-day scan Tuesday found 116 NYSE stocks achieving fresh new 52-week highs—here is a sample of five of these leading stocks and a quick glance at their daily chart with an emphasis on the uptrend and breakout that brought these stocks to the forefront of the scan.
We’ll also note similarities in these five names and note price levels to watch depending on whether the breakout continues or a retracement opportunity develops.
TD Ameritrade (AMTD) Daily Chart:
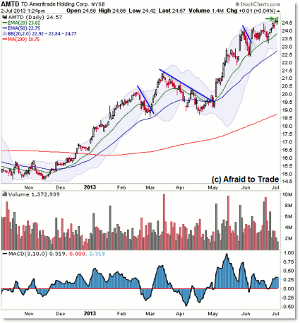
For TD Ameritrade shares, the stock has been strongly uptrending since the $14.50 low (corresponding with the SP500 swing low) in November 2012 toward Tuesday’s 52-week breakout high above $24.50 per share.
As we’ll see in most of these five names, daily chart reversal candles and an ongoing negative momentum divergence suggests caution and the preference for waiting to trade a retracement as opposed to jumping in on the (weak) breakout to new highs at least in TD Ameritrade shares.
Simple focal points to watch as reference levels will be the $24.00 per share level and the rising 20-day EMA into $23.84 (intersecting $24.00).
Look for a similar “bounce” off the rising 20d EMA as was the case June 24 or else look for a breakdown and close under the rising daily average to set up a bearish play toward the rising 50d EMA and lower Bollinger Band intersecting $23.00 per share.
Amazon.com (AMZN) Daily Chart:
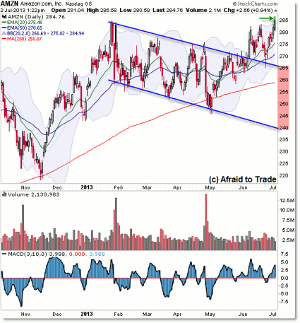
Our last update with Amazon discussed the inflection point in May and the possibility for a breakout (which occurred) or else a continuation swing within the boundaries of the falling trendlines as drawn.
The strong two-day breakout sets the stage for a retest of the 2013 highs and two “retracements” or flags back to the falling trendline support level and particularly the rising 20-day EMA set-up low-risk bullish support/retracement trades.
Tuesday’s continuation of the rally from the $270 reversal candle and confluence support low resulted in a breakout to new highs and an update of the key levels to watch for traders/investors.
The $283 per share horizontal support level serves as a critical support inflection level that will determine whether to take stop-losses or play bearishly short-term (on a breakdown) or else continue trading for higher prices or retracements that develop above $285 on a pathway toward the next “round number” target into $300 per share.
Ford Motor Company (F) Daily Chart:
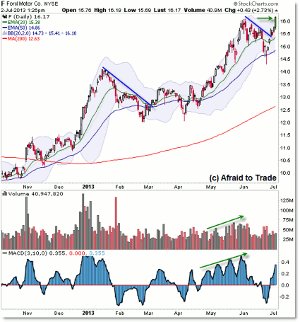
While the share price remains ‘low’ relative to other leading stocks, investors have enjoyed a larger than average percentage return from the recent movement from $10 to the current 52-week high Tuesday above $16.00 per share and the previous May high.
I drew two larger “bull flags” or retracement patterns to highlight the lower-risk opportunities to play (position or trade) a stock in a pro-trending rally phase, although trading a pure breakout recently above the $14.25 high from January did result in a stellar swing trading profit.
Continue monitoring the breakout above the $16.00 per share level with respect to a strong rally that brought us to this point and the “open air” under $16 to the next lower confluence support level into $15.50 (trendline and rising 20d EMA).
NEXT PAGE: 2 More Stocks to Watch
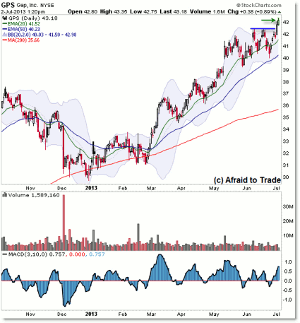
|pagebreak|The retail sector in general has been strong, and we see Gap Inc. (GPS) stock breaking to a fresh new 52-week high to continue the uptrend established from December 2012 and reaffirmed with the March 2013 breakout.
Price completed five retracement or ‘flag’ swing trading opportunities off the support of the rising 20-day EMA and price has now compressed around the $41.00 “value area” or midpoint of a compression pattern.
Gap Inc. (GPS) Daily Chart:
Tuesday’s pro-trend continuation and breakout continued from Monday’s breakthrough above the $42.50 level and we’re carefully watching for additional upside price action as price moves away from the $42.50 breakout level (short-sellers buy-back to cover and buyers step in to buy or add to existing positions—as is the case with any successful breakout event).
Gap is bullish unless we see a sudden ‘failure’ and reversal back under the breakout point which could carry price to the next lower support target—a retracement—of the rising 20d EMA just under $42.00 per share.
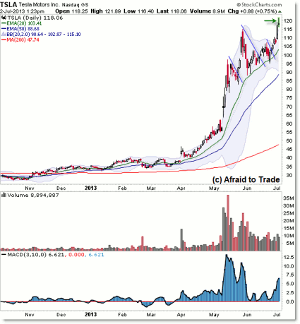
Finally, Tesla Motors (TSLA) Daily Chart:
I highlighted the breakout in Tesla (TSLA) shares for Monday’s stock update and the breakout event continued through Tueday’s session, though we see a clear caution sign developing from the intraday reversal and—so far—bearish candle developing into $120.
While the trend continues and Tesla (TSLA) has completed three retracement or bull flag opportunities, we see price extended from the rising 20-day EMA on a sustained rally where it’s generally “too late” to play a clean/low-risk breakout (which triggered Monday), but of course, not at all safe to play a retracement (price needs to trade lower to generate a retracement entry).
Though price accelerated in May along with volume, price continued higher yet volume trailed lower all the way to the present price breakthrough to the new 52-week (and all-time) high for the stock.
May 2013, itself, should remind us why it’s safer to trade with a trend than against it—note the two large gaps and the non-stop upward price impulse as investors along with traders rushed to get in on the upward price action and media attention.
Summary Thoughts
Continue watching these five selected names, along with any of the other 100+ names trading at new 52-week highs.
One area to watch is general Financials (popular ETF symbol XLF) and especially regional banks (popular ETF symbol KRE).
In Tuesday’s simple “show me NYSE stocks at new 52-week highs,” I added a filter of “show me only names with 20-day average volume greater than 2,000,000 shares per day and 38 stocks appeared on the list.
Of these 38 moderate/high average volume stocks on the NYSE making new 52 week highs, 21 of them (55%) were from the broader financial sector (out of nine major sectors).
Some of these names included Capital One Financial Group (COF), eTrade Financial (ETFC), Regions Bank (RF), and Charles Schwab (SCHW) to name a few.
Note that three of these names are popular brokerage firms (eTrade, Charles Schwab, and Ameritrade).
By Corey Rosenbloom, CMT, Trader and Blogger, AfraidToTrade.com


