Stoyan Bojinov of ETFdb.com looks through past booms and busts to offer insights about how the trends played out in retrospect and the price drivers behind it.
Timing the market has fascinated, frustrated, and confused the heck out of countless investors. Whether you’re a self-directed trader or a professional money manager, it’s very likely you’ve found yourself looking through charts, thinking: if only I could’ve had a piece of that trend! While it’s true that past performance is no guarantee of future returns, there is still a great deal of insights to be extracted from analyzing past booms and busts on Wall Street.
Below we take a stroll down memory lane with perfect hindsight and look at some of the best ETF trades of all time, highlighting their performance, as well as any noteworthy lessons from each case.
Please note that each return spans the low to the high price (and vice versa for short trades) from the indicated dates, not adjusted for dividends.
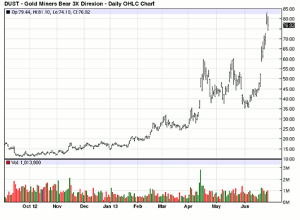
10. Gold Miners Bear 3x (DUST): Up 655% from 9/21/2012-6/26/2013
The Lesson Learned: If you’re trading commodity producers, make sure you understand the underlying natural resources market fundamentals. In this case, gold prices had made their third attempt at climbing past $1,800 an ounce only to falter in light of improving economic growth prospects and fears of rising interest rates soon thereafter. Second, remember that commodity producers can exhibit even greater volatility than the prices for the goods that they produce; for example, during this same period the SPDR Gold Trust (GLD) lost 31%, while the non-leveraged, non-inverse Gold Miners (GDX) shed nearly 59%.
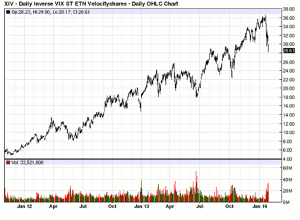
9. Inverse VIX Short-Term ETN (XIV): Up 650% from 11/21/2011-1/22/2014
The Lesson Learned: Don’t bet against the Federal Reserve. US markets took a dip in the summer of 2011 after QE2 ended and investors grew uncertain of the future. After a nasty trading stretch on Wall Street, policymakers offered confidence after they announced the start of “Operation Twist” at the end of September that same year; this in turn lifted the looming clouds of uncertainty, which sent volatility levels lower, and XIV and stocks higher.
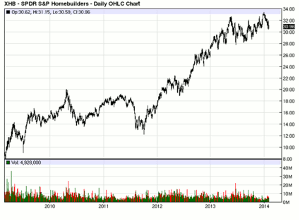
8. SPDR Homebuilders ETF (XHB): Up 328% from 3/09/2009-2/26/2014
The Lesson Learned: It takes a lot, and pays a lot, to buy when “there is blood on the street” so to speak. Among the best performing industries following the 2008 financial meltdown were the very same ones that got hit the hardest, the homebuilders and the banks. Remember the Internet bubble? Many of the tech bellwethers that got hit the hardest were among the strongest to rebound. The point here is that the culprits and victims behind bubbles can offer lucrative opportunities to those who are capable of buying when everybody else is still screaming “sell.”
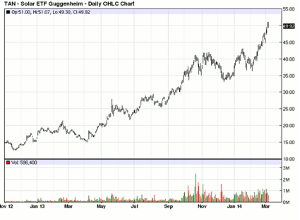
7. Solar ETF (TAN): Up 305% from 11/16/2012-3/7/2014
The Lesson Learned: Buying after a bubble bursts is risky, but it can pay off big time if you’re patient (and brave) enough. Solar stocks soared in 2007 as alternative energy prospects and President Obama’s commitment to the “green energy” revolution swept across the markets. However, they sank even faster the following year after Congress failed to renew investment tax credits for the solar industry, and the housing meltdown only intensified selling pressures. Nonetheless, after the dust settled, this has turned out to be a stellar rebound play with improving fundamentals aided by the shrinking costs associated with generating solar power.
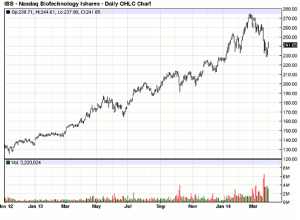
6. Nasdaq Biotechnology (IBB): Up 116% from 11/15/2012-2/25/2014
The Lesson Learned: There is always a fundamental story behind sustained market trends—so do your homework and find out what it is. In the case of biotech stocks soaring well past the broad US equity market throughout 2012, and even more so in 2013, the catalyst was quite clear: structural reforms in our healthcare system, and more specifically the passing of The Affordable Healthcare Act under Obama. Next time you spot an industry that is soaring far and above the broad market, don’t jump to the “must be a bubble” conclusion right away; do your homework and discover the fundamental price drivers. If you’re still convinced it’s a bubble, you may still short it with even greater conviction.
NEXT PAGE: 5 More Top EFT Trades
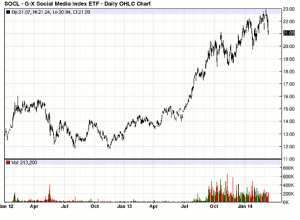
|pagebreak|5. Social Media Index ETF (SOCL): Up 107% from 1/5/2012-3/6/2014
The Lesson Learned: Be aware of single-stock biases in your ETF. The Facebook IPO was easily one of the most talked about stories in the financial world in 2012; likewise, the SOCL ETF garnered a ton of attention as many were excited to see the social media juggernaut added to its underlying portfolio. However, upon debuting, Facebook (FB) shares endured a rough start and dragged down SOCL. This all changed in the second half of 2013 after Facebook delivered blockbuster earnings results along with a very encouraging outlook for its mobile business; this in turn sparked a massive rally for Facebook shares and consequently SOCL.
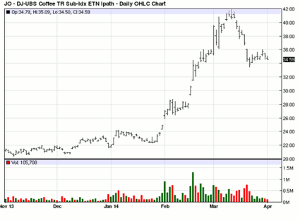
4. Dow Jones-UBS Coffee (JO): Up 106% from 11/6/2013-3/12/2014
The Lesson Learned: If you’re trading commodities, make sure you understand the fundamentals. Each natural resource market boasts its own set of quirks and nuances, which means investors need to do their homework before jumping into a position. In the case of coffee, Brazil produces over 40% of the world’s supply, which means that investors need to be aware of any major developments in the country, as they could have a meaningful impact on coffee prices. Needless to say, Brazil has endured a very hot and dry summer this year, which in turn put a strain on coffee’s supply and resulted in a massive spike in prices over a very short period of time.
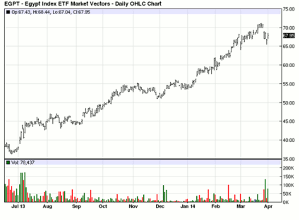
3. Egypt Index ETF (EGPT): Up 95% from 6/24/2013-3/25/2014
The Lesson Learned: Don’t bet on major reversals unless there is a fundamental catalyst at hand. Violent protests plagued the country of Egypt in the latter half of 2012, as mounting tensions between political groups led to a number of public uprisings. The Egypt ETF was seemingly headed into the ground as the political crisis appeared to only get worse by the day. However, a fundamental catalyst came on July 2, 2013, which reversed investors’ outlook from “extremely pessimistic’ to “hopeful.” EGPT soared on high volume after it was reported that Egyptian Armed Forces had issued an ultimatum that gave the country’s political parties a few days to meet the demands of the Egyptian people.
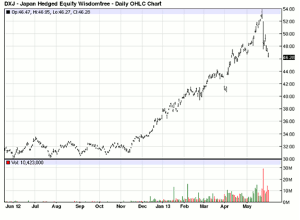
2. Japan Hedged Equity Fund (DXJ): Up 79% from 6/1/2012-5/22/2013
The Lesson Learned: Take advantage of shifts in monetary policy. At the end of 2012, Shinzo Abe secured his seat as Prime Minister of Japan and went on to embark on an aggressively expansive monetary policy in an effort to spur growth in the otherwise anemic economy. Fiscal stimulus, monetary easing, and promises of structural reforms aided the Japanese markets’ rise at the cost of the yen’s massive depreciation; rising equities and a falling yen in turn paved the way higher for dollar-hedged DXJ, which in hindsight was the perfect tool available for those who recognized the upcoming shift in Japan’s monetary policy.
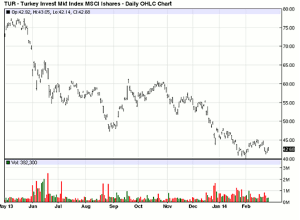
1. Short MSCI Turkey ETF (TUR): Up 48% from 5/22/2013-2/3/2014
The Lesson Learned: Policy changes at home can have a major impact on overseas markets. The mention of the word “taper” by the Fed in late May of 2013 sparked a selling frenzy across the emerging market world as investors jumped ship from risky currencies overseas to the safer US dollar in light of improving growth prospects and rising rates on the home front. The Turkey ETF was among the biggest losers from the so-called “taper tantrum,” showcasing the far reaching effects that domestic monetary policy can have around the globe.
The Bottom Line
Looking through past booms and busts offers insights about not only how the trend played out in retrospect, but also about the price drivers behind it. Plain and simple, successful investing is a fine balancing act between fundamental analysis and the ability to pinpoint attractive entry and exit points. Every chart has a story behind it, so do your homework and find out what it is before pulling the trigger on a trade.
By Stoyan Bojinov, Contributor, ETFdb.com


