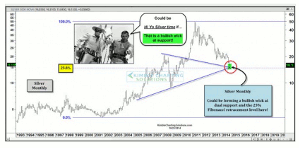
Chris Kimble, of Kimble Charting Solutions, explains what an ideal ‘Power of the Pattern” situation looks like, charts the recent rally of silver, suggests that it may not be over yet, and offers a way to play it with this silver mining company.
I often get asked, "What does an ideal Power of the Pattern setup look like?" For us, an ideal setup has these common features:
- Support/channel lines come into play,
- along with a Fibonacci support/resistance level,
- and a bullish or bearish wedge pattern is near completion.
When it comes to ideal pattern setups, it didn't come much better than what presented itself 20 days ago. The Power of the Pattern started sharing two years ago that silver could reach the $15 level, which could present a good buy point.
After waiting over two years for silver to near the price zone ($15) that interested us, Silver Wheaton (SLW) created what looked like a nice setup that we couldn't pass up, as it was hitting channel and Fibonacci support at the same time a bullish descending triangle was about to end at (1) above, with few investors bullish silver at the time.
Our members picked up SLW 20 days ago due to this setup, and since then, a nice breakout and a nice gain has taken place. (SLW is up over 20% more than SPY in the past 20 days). Is it too late to get in on this trade? A very nice risk/reward entry point did come into play on November 6. One thing that does stick out to me is this...sideways channel resistance comes into hand around the $27 level, which is still a large percentage above current prices.
Last week I shared the "Monthly Silver" chart above, discussing that a bullish wick could be forming at dual support and the 23% Fibonacci support level. The month is not over with at this time. Should silver end the month higher than it closed Monday night, it would appear that a bullish wick on a monthly basis took place at key levels.
By Chris Kimble, Founder, Kimble Charting Solutions


