Technician Corey Rosenbloom, of AfraidToTrade.com, suggests that traders take note of the clear trend line—and the clear levels to watch—in the S&P 500.
Short-term traders benefit from taking a moment to view the larger picture of ongoing trends.
There’s a clear trend—and clear levels to watch—in the S&P 500 (SPX) during the ongoing bull market.
Let’s update our Parallel Trend Line Channel Structure and note what levels are important here.
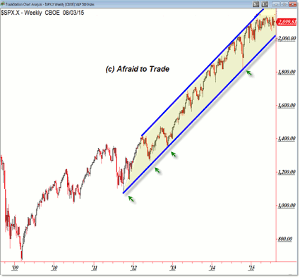
First, here’s the broader picture of the S&P 500 trend stretching back to the 2009 Reversal Low.
During QE1 and QE2, stock prices rallied impulsively higher and corrected (retraced) during periods without Quantitative Easing from the Federal Reserve.
The current trend phase (highlighted) began late 2011 and has continued without a change in the pattern.
Note the Rising Parallel Trend Line Channel that continues to contain price within the upper and lower levels.
Price has spent more time scraping against the upper trend line and only four touches (tests) of the lower line.
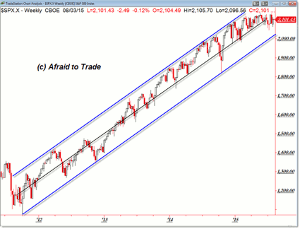
We can actually see a better perspective of the key levels by viewing a tighter perspective:
Again, we see the beginning of this pattern stretching back to late 2011 (without end at the moment).
For now, the lower trend line extends above 2,000 while the Midpoint (black) intersects the 2,135 price high.
Our upper trend line channel stretches above 2,200 and would be a valid target if price does begin another rally phase.
For now, we’re on guard for another potential touch of the lower rising trend line above 2,000.
This can happen either by price continuing to trade sideways as it has through all of 2015 as the trend line rises.
However, price could fall sharply once again down to this level before reversing higher to continue the trend.
Either way, note the pattern, levels, and continue planning your trades within this ongoing structure.
By Corey Rosenbloom, CMT, Trader and Blogger, AfraidToTrade.com


