Technical signals suggest two of the most oversold stocks on the Nasdaq 100 are likely to underperform the broad markets, while two others appear to be good buys for after the ongoing correction.
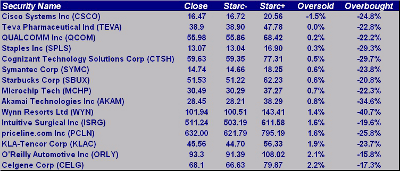
The PowerShares QQQ Trust (QQQ), which tracks the Nasdaq 100 Index, was hit hard last week, declining 4.3% for the week, 1% worse than the Spyder Trust (SPY). QQQ is down 11.3% from the April 3 highs and closed last week just 0.6% above its weekly Starc- band.
Starc band analysis gives a reading of whether a stock is a high- or low-risk buy at the time. Close proximity to the upper Starc band (Starc+) means it is a high-risk time to buy since the stock is likely to at least move sideways, if not decline. Conversely, when a stock closes near its lower Starc band (Starc-), it is a high risk time to sell since the chances of a rebound are high.
For more on trading with Starc bands, click here.
The table below shows the 15 Nasdaq 100 stocks that are closest to their weekly Starc- bands. At the top of the list is Cisco Systems (CSCO), which closed last week 1.5% below its weekly Starc- band.
Just because a stock is oversold does not automatically make it a buy, as one needs to do further analysis to isolate those stocks that are in intermediate uptrends and where the relative performance analysis indicates they are outperforming the S&P 500.
The top two stocks on the list have chart patterns and technical readings that indicate their recent strength was just a rebound within the major downtrends. Two of the most oversold stocks do look like long term buys on a test of more important chart and Fibonacci retracement support.
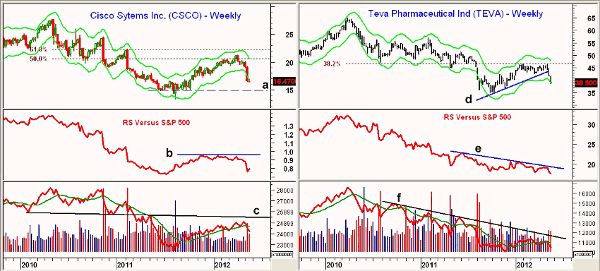
Chart Analysis: Cisco Systems Inc. (CSCO) peaked at $27.74 in April 2010 and lost just over half its value by August 2011 when it made a low of $13.30. By early-April 2012, it has rebounded to $21.30, which was just above the major 50% Fibonacci retracement resistance at $20.52.
- It is important to note the 61.8% retracement resistance at $22.23 was not exceeded, suggesting that the rally was just a rebound within the overall downtrend
- CSCO plunged on May 10 in reaction to disappointing guidance in its earnings report
- It is already down 22.7% from its highs and has been below its weekly Starc- band for the past two weeks
- Next major support on the weekly chart, line a, is in the $15 area
- As CSCO was moving higher, the relative performance, or RS analysis, was flat, line b. It has now dropped sharply, indicating CSCO is weaker than the S&P 500
- On-balance-volume (OBV) has dropped below its weighted moving average (WMA) and failed to even reach the major resistance at line c
- Near-term resistance for CSCO now stands at $18
Teva Pharmaceutical Industries (TEVA) is a $33 billion maker of generic drugs. TEVA closed below its uptrend, line d, two weeks ago, and is down 16% in the past three weeks. This completed the continuation pattern.
- The rally from the 2011 lows just reached the major 38.2% Fibonacci retracement resistance from the 2010 high at $64.95
- Next support is between $36.88 and $35
- RS analysis declined, line e, as TEVA was moving higher. This was a sign of weakness, and it has continued to act weaker than the S&P 500
- Weekly OBV is also in a longer-term downtrend, line f, suggesting that the buying was weak on the rally
- There is first resistance for TEVA in the $41-$42 area
NEXT: 2 Good Buys for After the Correction
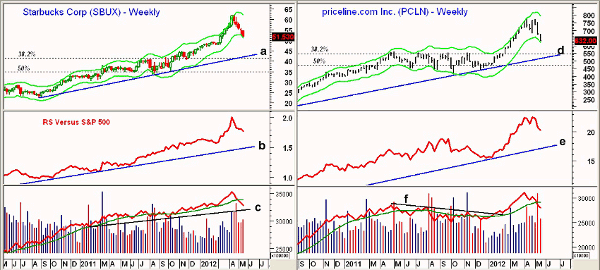
|pagebreak|Starbucks Corp (SBUX) closed above its weekly Starc+ band in late March and peaked in April at $62.
- With last Friday’s close at $51.53, the stock is down 16.9% from its highs
- Weekly chart has next good support in the $47.80-$49 area with more important support at $44.50-$45
- The longer-term uptrend, line a, is at $42.30 with the major 38.2% retracement support from the 2009 lows at $40.94
- RS analysis did make new highs with prices in April but has since turned lower. The long-term uptrend in the RS, line b, is positive for the intermediate-term uptrend
- Weekly OBV also made new highs with prices but has now dropped below its weighted moving average. It is still above its uptrend, line c
- There is initial resistance for SBUX at $53.50
Priceline.com Inc. (PCLN) also tested its weekly Starc+ band in early April before reversing to the downside. It closed last week on its lows and is just 1.6% above its weekly Starc- band at $621.79. PCLN is down 18.4% from its highs.
- The weekly chart shows good support in the $560-$554 area with the 38.2% Fibonacci retracement support from the 2010 lows now at $544
- Weekly uptrend, line d, is in the $520 area
- The RS line did confirm the April price highs but is in a strong uptrend, line e
- Weekly OBV did make new highs with prices, which is positive, but it has now dropped back below its weighted moving average
- The January breakout in the OBV above resistance, line f, signaled the 40% rally
- Initial resistance is now at $675-$700
What It Means: The Fibonacci retracement resistance and RS analysis indicate that the two most oversold Nasdaq stocks, Cisco Systems Inc. (CSCO) and Teva Pharmaceutical Industries (TEVA), are likely to stay weaker than the S&P 500. Both could test, if not break, the 2011 lows, and though many analysts are touting CSCO as a great value buy, the technical outlook suggests otherwise.
On the other hand, the OBV and RS analysis suggests that after the current correction runs its course, Starbucks Corp. (SBUX) and Priceline.com Inc. (PCLN) should continue to outperform the S&P 500.
How to Profit: For Starbucks Corp. (SBUX), go 50% long at $50.58 and 50% long at $49.46 with a stop at $46.74 (risk of approx. 6.4%).
For Priceline.com Inc. (PCLN), go 50% long at $574.60 and 50% long at $550.46 with a stop at $524.44 (risk of approx. 6.8%).


