Stocks finished last week in an impressive fashion and the early sales numbers suggest that the holiday shopping season has gotten off to a strong start. The string of five higher consecutive closes in the Spyder Trust (SPY) has taken it back to the 50% Fibonacci retracement resistance at $141.44.
Though the Dow Industrials has closed back above the 13,000 level, it is still below its 50% retracement resistance at 13,066. The rally is likely to stall over the near term and the futures are a bit lower early Monday.
The rally has been impressive enough to set the stage for a market bottom and a likely rally into yearend. The intermediate technical evidence still does not indicate that a major top has been formed and the weekly NYSE A/D line turned higher last week.
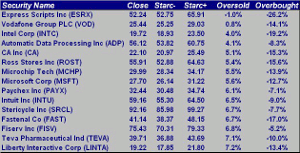
The beaten down Nasdaq 100 will take more time to bottom as it has just reached the 38.2% Fibonacci retracement resistance level at 2640 with the 50% level at 2685. That does not mean one should ignore these stocks, and therefore, I was interested in looking at those Nasdaq 100 stocks that were the most oversold.
The weekend starc band analysis on the Nasdaq 100 revealed that many known names were amongst the most oversold that are ranked by their proximity to their weekly starc- band. It is important to remember that just because a stock is near its starc- band, it does not mean it can’t go lower but it is considered to be in a high risk sell zone.
Only one stock Express Scripts Inc. (ESRX) is actually below its weekly starc- band. As I examine each of the stocks on the list I focus on those where the OBV did confirm the previous highs and where the charts indicate that the worst of the selling is likely over. Two stocks on the most oversold stocks look like attractive buys as they retest important support.
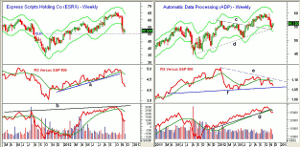
Chart Analysis: Express Scripts Inc. (ESRX) was hit early in the month as even though it reported strong third quarter earnings, its CEO commented that analysts’ estimates were too high.
- At the low two weeks ago at $49.79, the stock was down 24.6% from the recent high at $66.06.
- The weekly starc- band has been tested over the past three weeks as the June lows at $50.31 were slightly broken.
- The 50% Fibonacci retracement support from the 201 lows has been reached.
- The weekly relative performance or RS did confirm the recent highs before plunging through its support, line a, and its WMA.
- The weekly OBV formed a pattern of higher highs, line b, but volume was heavy on the recent decline as it has dropped well below its WMA.
- The daily technical studies (not shown) are still negative.
- There is weekly resistance in the $54-$55 area with a gap between $56.17 and $61.79.
Automatic Data Processing Inc. (ADP) closed last week just over 4% above its weekly starc- band. The chart shows that converging support, lines c and d, were tested the prior week as the low was $54.02.
- In June 2012, ADP had a low of $50.89 so the weekly uptrend is still clearly intact.
- The relative performance has dropped back below its WMA and has longer term support at line f.
- The RS line did not make new highs on the most recent rally, line e.
- The weekly OBV did make new highs in early October but then dropped below its WMA and short term support at line g.
- The OBV has turned up, which is consistent with a correction, not a top. It will need to move strongly back above its WMA on the next rally.
- The daily OBV (not shown) is still below its declining WMA.
- There is first strong resistance now for ADP in the $57-$57.50 area.
UP NEXT: Intuit Inc. and Stericycle Inc. |pagebreak|
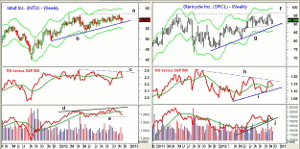
Intuit Inc. (INTU) is down just over 4% from the high two weeks ago at $42.10. Since the market high on September 14, it is down 1.8% versus the 4.5% decline in the Spyder Trust (SPY).
- The support going back to the November 2011 lows, line b, was tested over the past two weeks as the low was $57.60 just above the September low at $57.55.
- INTU did not rally as much as the S&P 500 last week so the relative performance has turned down and dropped slightly below its flat WMA.
- The RS line needs to move through the resistance at line c to signal that it is a market leader.
- The weekly on-balance volume (OBV) did make new highs in early October but has declined steadily from the highs, dropping back below its WMA.
- There is next OBV support at the May-June lows, line e.
- There is first resistance now at $61.60 and then at $62, line a. An upside breakout would have targets in the $67 area.
Stericycle Inc. (SRCL) closed on the week’s highs as support in the $88.90 area and the long-term uptrend, line g, are still holding.
- The relative performance or RS line has formed lower highs, line h, since late 2011. It turned lower last week, but is still above its WMA.
- A drop below the summer lows and the support at line i would signal that SRCL is acting weaker that the S&P 500.
- The weekly OBV shows a more positive pattern as it has again turned up from its uptrend, line j, and its WMA.
- The daily technical studies (not shown) have turned up but are still negative.
- There is near-term resistance for SRCL at $94.77-$96.31.
- The weekly chart shows a broad trading range, lines f and g, which appears to be a continuation pattern. An upside breakout would signal a move to the $110-$117 area.
What it Means: The recent rally has lasted a bit longer than those on the short side of the market expected. We could see a bit more short covering before the market digests its recent gains. One or two more days of heavy selling cannot be ruled out and could be triggered by news on Greece or the fiscal cliff. Thankfully, the conflict in the Gaza Strip appears to have been resolved for now.
Though the overseas markets do appear to have completed their corrections, the daily studies on the US market averages are still negative. Therefore a cautious buying approach is suggested and the tight ranges along with the OBV analysis make Intuit Inc. (INTU) and Stericycle Inc. (SRCL) my favorites.
If the market is bottoming, stocks like Automatic Data Processing Inc. (ADP) should hold above the lows that were made the week before Thanksgiving. Though Express Scripts Inc. (ESRX) is likely to see an oversold bounce, it is more suitable for traders. For a stop placement would suggest just under $49, which is under the January 14 close.
How to Profit: For Intuit Inc. (INTU), go 50% long at $58.56 and 50% long at $58.12 with a stop at $56.57 (risk of approx. 3%).
For Stericycle Inc. (SRCL), go 50% long at $91.06 and 50% long at $90.52 with a stop at $87.77 (risk of approx. 3.3%).
For Automatic Data Processing Inc. (ADP), go 50% long at $55.44 and 50% long at $55.02 with a stop at $53.38 (risk of approx. 3.2%).


