As earnings season kicks off this week, MoneyShow’s Tom Aspray takes a technical look at some of IBD’s recommended stocks to see if they now present good buy opportunities with the most recent pullback.
The week ended on a truly ugly note as after making new highs early, the averages reversed to close the day lower. The PowerShares QQQ Trust (QQQ) was down 2.66% on the day with the iShares Nasdaq Biotechnology (IBB) losing just over 4%. It is now down 0.78% for the year while the QQQ is down 1.17%.
Normally, such a daily reversal would be consistent with a significant top but the very recent new highs in the NYSE Advance/Decline, as well as the S&P 500 A/D line, suggest this is not the case. Therefore, I think the divergence between the averages is more likely part of a sector rotation, which has been a dominant trend so far in 2014.
There were other divergences, Friday, as the Vanguard European Stock Index (VGK) was down just 0.40% and is up 1.98% so far in 2014. The Vanguard Emerging Market Index (VWO) was down just 0.17% for the day. Of course, they could catch up on Monday. Tech stocks in Asia have been hit by selling on Monday.
The futures are down in early trading, and as I discussed in the Week Ahead column, I would look for a rebound by the middle of the week and the strength of any rebound will be important.
The Investor’s Business Daily top 50 stocks is a computer-generated watch list of market-leading growth stocks. They use earnings, sales, and price action but recommend only purchasing these stocks when they are near “buy points.” Their list often includes many of the high-momentum stocks. so after last week’s heavy selling, how did their top four stocks perform?
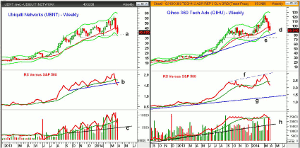
Chart Analysis: Ubiquiti Networks (UBNT), a $3.56 billion wireless communications company, lost 5.94% on Friday consistent with its beta of 1.94.
- UBNT hit a high of $56.84 and with Friday’s close at $40.52 is down over 28% from its high.
- The weekly chart shows next support, line a, in the $38 area.
- The weekly starc - band is at $37.56 with the quarterly projected pivot support at $36.35.
- The weekly relative performance bottomed out last summer when the stock was trading in the $21 area.
- The RS line has dropped below its WMA and support at line b.
- The weekly OBV closed just below its WMA but like the RS line did confirm the recent highs.
- The OBV is still well above longer-term support at line c.
- The daily OBV broke support on March 24 and has dropped above 29% since.
- There is first strong resistance in the $44-$45.50 area with the early April swing high at $47.92.
Qihoo 360 Technology Co. Ltd. (QIHU) is a $10.9 billion dollar Chinese provider of Internet and wireless security products that lost 3.86% on Friday. The stock has a beta of 1.84.
- The company’s 360 Safeguard XP Shield has gotten quite a bit of attention as Microsoft ends its support of XP on Tuesday.
- The stock tested its weekly starc band during the first week of March when it made a high of $124.42.
- QIHU has lost 28% from its high but is still above the late March low of $87.50.
- The weekly starc- band is at $83.13 with the monthly projected pivot support at $83.25.
- The weekly relative performance did confirm the recent highs, line f, but has now dropped below its WMA.
- The RS has long-term support at line g.
- The weekly OBV closed last week below its WMA as volume has been heavy over the past two weeks.
- The daily OBV (not shown) does look weaker as it is below former support.
- There is initial resistance now at $94-$96.50 with the declining 20-day EMA at $101.63.
- The quarterly pivot is at $100.90.
NEXT PAGE: 2 More IBD Top 50 Stocks
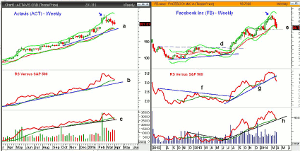
|pagebreak|Actavis (ACT) is a $25.09 billion global manufacturer and distributor of generic drugs with a low beta of 0.34.
- During the last two weeks of February, ACT closed above its weekly starc+ bands, reaching a high of $230.77.
- With Friday’s close at $201.31, it is now down 12.7% from its high as it closed just above the quarterly pivot at $201.00.
- The monthly projected pivot support is at $193.70.
- The relative performance did confirm the recent highs and has just pulled back to its WMA.
- The RS line has further support at line b.
- The on-balance volume (OBV) closed last week below its WMA and is now testing support at line c.
- The daily OBV (not shown) has been below its WMA since March 6 and shows no signs yet of bottoming.
- There is first resistance now at the monthly pivot of $210.55 and then stronger in the $218-$220 area.
Facebook Inc. (FB) is the 4th stock on IBD top 50 list and has a beta of 1.77. In their weekend edition, they commented that the stock “reversed lower this week and fell 5% in heavy volume.”
- They also pointed out that it was “close to round-tripping a $54.93 buy point.”
- From the March 11 high of $72.59 it is now down 21.8%.
- Friday’s close was below the quarterly pivot at $61.56 with monthly projected pivot support at $54.62.
- The low in late January was $51.85 with the quarterly projected pivot support at $50.53.
- This seems like a potential downside target.
- Over the past two weeks, the relative performance has dropped below both its uptrend, line g, and its WMA.
- The RS line broke through resistance (line f) last August signaling it was a market leader.
- The weekly OBV made a significant new high before dropping back to its uptrend, line h.
- The WMA is also being tested but it is rising, which is a positive sign.
- There is resistance now in the $60.35- $62.00 area.
What It Means: IBD’s top 50 is often a good source for trading ideas as many of its stocks are more volatile than the major averages. They now classify that the “market is in correction mode” and advise not letting any stock drop 7% below your entry point.
This is more than I like to risk but from a technical perspective, IBD provides many more charts than the WSJ, and if you have not taken a look at it, you might consider one of their free two-week trials.
The current decline could drop some of the Dow’s most overbought stocks back to long-term support and my recommended buy levels.
How to Profit: no new recommendation.


