Ichimoku visualizes a lesson that is very hard for most traders to learn. That lesson is that when price is above the cloud, which is the definition of an uptrend with the indicator, there is no such thing as overbought. This understanding can help you get more out of a trend and put to bed the tough strategy of picking tops and bottoms, says Tyler Yell of DailyFX.com.
When everyday traders like you and me believe that we can pick a top or bottom, we’re often giving ourselves too much credit for our market analysis ability. Ichimoku can be a great help to you if you allow yourself to follow the main rule of this indicator. That main rule is to only look for buying opportunities when price is above the cloud.
As FXCM has seen from the Speculative Sentiment Index, many traders have tried to pick the top of a lot of these JPY cross trades. As you can see from the chart below that’s a costly bet with low odds when there is such a strong move even if you’re setting stops.
EUR/JPY, H4 Chart with Ichimoku Applied

Created with Marketscope/Trading Station II
Click
to Enlarge
There is No Such Thing as Overbought When Price is Above the Cloud
The above statement is a paradigm shift for a lot of new traders. After all, oscillators help traders see overbought or oversold conditions and they are often the first thing learned. However, what these same new traders find is that trending markets can stay in an “overbought” condition for days/weeks/months as the trend continues as we’ve see with any currency against the JPY.
This concept that overbought conditions do not exist in an uptrend is important for you to understand. Understanding and applying this will help you get more out of a trend and will hopefully prevent you from taking the bait and trying to sell into an uptrend. Overbought simply means that it’s higher than you thought it should be. Naturally, there will still be pullbacks and that will help us identify entries.
Is There A Chance For Me To Get Into The Trend Once It Started?
Entering after a strong move like we’ve seen in the yen to the downside can be tough, but it’s not impossible. Naturally, the first thing you want to do is find a pullback trade in the direction of the trend. You can also look to a continuation pattern within the up move before entering the trend or scaling into the trade you’re already in.
When using Ichimoku you can move to a smaller timeframe like a one-hour candle chart or four-hour chart and wait for the Ichimoku rules to align. One of the great things about Ichimoku is that the rules are effective across the board. You simply need to adjust targets and exits with the chart you’re analyzing.
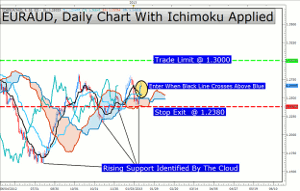
This Week’s Ichimoku Trade: Pending BUY EUR/AUD
EUR/AUD, Pending Ichimoku Trade

Created with Marketscope/Trading Station II
Click
to Enlarge
When you scroll though all currencies with the Ichimoku indicator applied, it’s easy to see that the EUR is the strongest and JPY is the weakest. Naturally, we’ll find the best entries with the strongest currencies. The only thing we need to ensure is that the Ichimoku rules align. If this is your first reading of the Ichimoku report, here is a recap of the rules:
- Price is above the Kumo Cloud
- The trigger line (Tenkan Sen) is above the base line (Kijun Sen) or has crossed above
- Lagging line is above price action from 26 periods ago
- Kumo ahead of price is bullish and rising (displayed as a blue cloud)
- Entry price is not more than 150 pips away from the Tenkan Sen/trigger line as it will likely whip back to the line if we enter on an extended move.
With the chart above, we’re going to wait for the trigger line (Black) crosses above the base line (Baby Blue) before entering a buy trade. Once that condition is met, here is our trade:
Ichimoku Trade: Buy EUR/AUD When trigger line crosses above base line
Stop: 1.2380
Limit: 1.3000
By Tyler Yell, Trading Instructor, DailyFX.com


