Like any other market, forex makes some really nice swings in price, which when identified can give you an opportunity for an excellent trade, notes Pete Southern of LiveWire Market Blog.
Swing trading is the art of catching a changing trend and riding it out in the other direction or “swinging” for use of a better phrase! The key to being successful with swing trading is to have a solid method for picking direction changes. There are various ways to do this but for this article I will cover my own favorite. It comprises of a few steps, but by following each one you can be more certain the patterns you are looking at will work out.
Identify Support or Resistance
First and most importantly, you cannot swing trade forex properly unless you can identify clear areas where the price may react from. This is how the big boys play the game, and if done correctly, it can show you excellent areas to watch for entries.
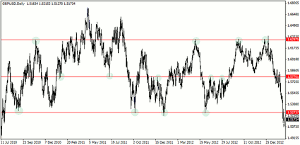
Draw some horizontal lines on your charts. Connect some previous highs and lows. Look for areas where the price has reversed a couple of times in the past, highlight them with a horizontal line and leave them on your chart. These will form the blueprint for your swing trading.
Obviously as time progresses and the more often these lines have been tested in the past, the stronger and more important they become. What you should be looking for is an area that has been tested at least twice, and if it’s within a larger range (like the middle line above) then tests from both directions for support and resistance is essential. These are the areas at which you will be looking to trade from.
Now there are some traders who will just go shorting into resistance or longing into support. In my opinion this is a hit and hope strategy. You will be undone time and time again doing this, and even with good money management, the strain on your emotions will eventually take your edge.
Once the price is heading into one of these areas, it is time to drill down onto a shorter timeframe chart and start watching the patterns.
NEXT PAGE: Lower Risk Entries
|pagebreak|
Tests and Retests
The safest way to use these potential reverse points is to look for retests and failures. If you drop down to a 4-hour or 1-hour chart, leaving the same lines active from your longer term chart, look for the price to attempt to break or test the areas and pull back. But don’t rush, there are still further triggers to find a better and safer entry.
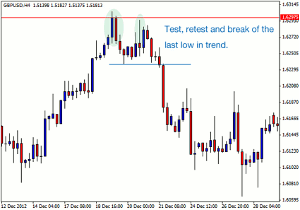
For the sake of this example, we will zoom in on a 4-hour chart at the last major test of the top resistance line on GBP/USD, which happened around December 19, 2012. I have highlighted two important patterns in the candles on the chart. The first one is a clear test of the resistance area. The two solid candles signal a move into resistance and a clear rejection. This is followed by a low in price before it tries to test the resistance once more. This time the pattern I highlighted is a long wick rejection candle. It was quickly sold off when it attempted to reach the high, this is a good sign. Then the key to entry was a break of the recent low. The swing point as such. These types of entries can give you a safer entry point than just hoping resistance holds and shorting at the top. Granted you may miss a few pips, but if managed correctly and trailed with a take-profit stop, you can exit quite neatly as momentum builds below the swing.
Momentum Indicators
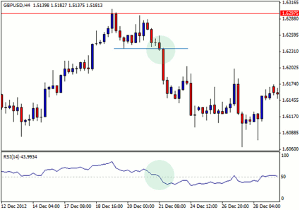
Although I tend not to use many indicators for entering trades, there are some which can be quite useful showing you when momentum is building into the direction you are looking to swing. RSI and Stochastic can be good tools to use. When the price is breaking below the swing or low point take a glance at the RSI, is it dropping below 50 line? This (in my opinion) is the only useful line on RSI indicators. Momentum for direction change is often signaled by a crossing of the 50 line. It really is worth noting when entering a swing trade.
Try this out. Draw some lines on longer-term charts and find the resistance or support areas. Look at past reactions around these levels in shorter time frames. You will see similar patterns on most tests that have turned. These offer you a great way to swing trade forex with lower risk entries.
By Pete Southern, Technical Analysis Contributor, LiveWire Market Blog. Follow him @livechartsuk.


