
Kristian Kerr, of DailyFX.com, offers his technical analysis for two currency pairs and crude oil and shares his current forex trading strategy for each, along with the key levels to watch moving forward.
Talking Points
- USD/JPY touches 12-year high
- Crude breaks key downside pivot
- GBP/USD struggles lower but for how long?
Foreign Exchange Price and Time at a Glance:
Price and Time Analysis: USD/JPY
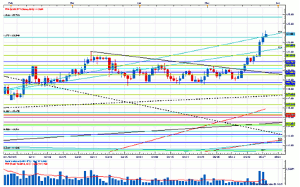
Charts Created using Marketscope—Prepared by Kristian Kerr
Click to Enlarge
- USD/JPY broke above the 2007 high at 124.14 Thursday to trade at its highest level in 12-years
- Our near-term trend bias is higher in USD/JPY while above 122.60
- A close above 124.15 is needed to confirm that a more meaningful move higher is underway
- A very minor cycle turn window is eyed Thursday
- A close below 122.60 would turn us negative on the exchange rate
USD/JPY Strategy: Like the Long Side While Above 122.60
![]()
Price and Time Analysis: Crude
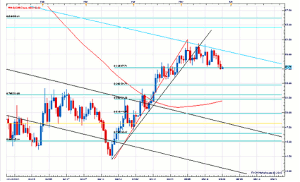
Charts Created using Marketscope—Prepared by Kristian Kerr
Click to Enlarge
- Crude traded at a new low for the month Wednesday
- Our near-term trend bias is lower in oil while below 60.75
- A daily settlement below Fibonacci support at 57.70 is needed to trigger another bout of weakness in the commodity
- A very minor turn window is eyed Thursday
- Any traction over 60.75 would turn us positive on Crude
Crude Strategy: Like the Short Side While Below 60.75
![]()
Focus Chart of the Day: GBP/USD
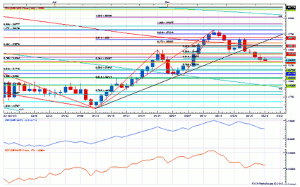
Click to Enlarge
GBP/USD has followed its European counterparts lower over the past couple of weeks, but the decline has been far from dynamic. The euro, for instance, has already retraced more than 61.8% of its move off the March lows, while cable only just tested the 38% retracement of the April-May advance Wednesday. There are signs materializing, however, that suggest the pound is vulnerable to playing a bit of catch up. Last week, the trendline connecting the April and May lows was breached, which has put Sterling into a weak position. That break was followed by a move through the 50% retracement of the May range this week. Our focus is now on the 50% retracement of the year’s range just under 1.5200 as traction below there should provide enough evidence that the rate has turned. Short-term cycle analysis suggests there is some risk of some backfilling over the next few days, but only a move back through the 200-day moving average near 1.5560 would call into question the near-term negative view.
By Kristian Kerr, Senior Currency Strategist, DailyFX.com


