Historically, the last two weeks of November are tough for stocks, so looking back over the last five years, MoneyShow’s Tom Aspray uses seasonal trend analysis to determine which of two scenarios will likely play out for the last six weeks of the year.
Stocks continued to grind higher last week, but the ranges have continued to narrow as the rally from the October lows has progressed. The close on Friday will determine whether we have a higher weekly close or not as after Thursday’s close, the Spyder Trust (SPY) is up just 0.40% for the week.
In last week’s column Three Reasons Not to Jump into Stocks Now, I shared the reasons why I thought the market should not be chased at current levels. So far, neither the technical action nor sentiment picture has changed enough to turn me more bullish than I was last week.
The seasonal trend analysis indicates that, historically, the last two weeks of November are a tough time for stocks. Looking at the last five years—in the context of the recent stock market action—suggests two likely scenarios for the last six weeks of the year.
The price action of the past two years does not fit well with the current market. In 2013, the stock market rallied from the October 9 lows until the end of November. After a two week consolidation, the market moved higher into yearend.
In 2012, stocks peaked at the beginning of October and then bottomed on November 16. Stocks moved generally higher until yearend, though they did have a pullback in the last six days of the year.
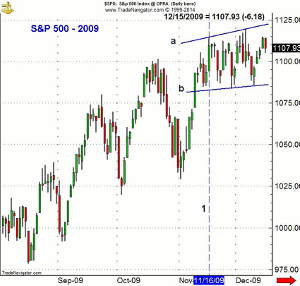
The price action this year could end up following the path of 2009, which is one possible scenario. Then the S&P 500 made its monthly high on November 16 (line 1) but then moved in a range until the end of the month. The S&P did make a marginal new high in early December before, again, dropping back to the lower boundaries of its range, line b. This period of consolidation (lines a and b) set the stage for a move to new highs at the end of the year.
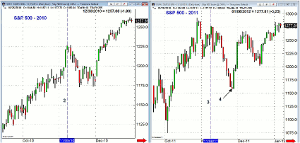
Or this year may be more like 2010 when the S&P 500 peaked on November 5 (line 2), and by the end of the month, had already lost almost 50 S&P points. From high to low, this was a correction of 4.4%. The stock market turned higher on the first day of December and rallied sharply into the end of the year. From the low to high, it recorded a gain of 7.4%.
The pattern was similar in 2011 as the S&P made its high on November 8 and then dropped 9.1% to make its low on November 25, which was Black Friday (point 4). The S&P 500 then moved higher in a zig-zag fashion until the end of the year, closing just below the November 8 closing level.
This is the second likely scenario and the one I currently favor. This would mean that stocks could see a 3-5% correction or more into early, or even the middle of December. This could take the Spyder Trust (SPY) down to the $196-$200 area from the recent high above $204.00.
Whether it forms a broader trading range or does sees a sharper correction over the next few weeks, I think either will be followed by yearend rally in the S&P 500. This rally could be fueled by underinvested money managers struggling to match their benchmarks.
The two primary hurdles the market is facing right now are the concerns over the EuroZone economic recovery and whether Putin is going to raise the stakes further in Ukraine. Of course, one can never rule out new developments in the Middle East.
The data from the EuroZone late last week was a bit better than expected, but with a last quarter GDP growth of 0.6%, that is not saying much. So far, the recent EuroZone stimulus measures have not resulted in new investment or job growth with the stronger economies such as Germany and Austria now facing stagnation.
There were some bright spots in the latest data as both Spain and Greece came in better than expected with Greece’s 0.7% growth the best in the EuroZone.
NEXT PAGE: What to Watch
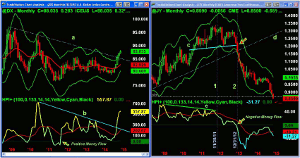
|pagebreak|The currency markets have clearly played a role in the US market’s recent strength as the strong dollar makes both our stocks and bonds more attractive. In September, the Dollar Index broke though its monthly downtrend, line a, that goes back to 2009. The Index is trading above its monthly starc- band for the third month in a row, so a period of consolidation or a correction would not be surprising.
The Herrick Payoff Index (HPI), which uses volume and open interest, indicated positive money flow for the dollar in 2011 when it moved above the zero line (point 1). The HPI has also broken its downtrend, line b, confirming the price action.
The recent drop in the Japanese yen has also gotten the attention of the global markets and has put additional pressure on some hedge funds. The drop in the Yen futures below support, line c, in late 2012 suggested to me that it could eventually drop to the 0.8000 area.
The HPI had formed a long-term negative divergence at the late 2011 highs, line e, before dropping below its WMA on November 30, 2011 (line 1). A year later, the HPI dropped below the zero line (line 2) as the uptrend in the futures, line d, was broken. This negative money flow indicated the yen futures could fall sharply. The yen futures are also now below the starc- band and are now in a high risk sell zone.
The sharply higher dollar has accentuated the negative technical readings for crude oil and gold (Two Worst Markets in Any Time Frame) as both have dropped even further. The negative sentiment is quite high on both, but there are no signs yet of a bottom. Many individual investors have apparently been flocking to silver, but, as I noted last week, it also looks negative technically.
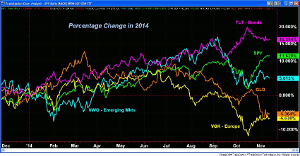
From the updated 2014 asset classes chart one can see that the Vanguard FTSE Europe ETF (VGK) is now down almost 7% for the year after being up over 7% in June. Most of the EuroZone markets have been under pressure but I still expect them to do better in 2015.
VGK is doing just a bit better that the SPDR Gold Trust (GLD), which was up close to 13% in March. The iShares Barclay 20+ Year Treasury (TLT) continues to lead as it was up 16.5% early Friday. The Spyder Trust (SPY) has made new highs for the year in the past month as it is up 11.5%, which is just about double the performance of the Vanguard Emerging Markets (VWO).
The Retail Sales data last Friday was better than expected as they were up 0.3% versus a 0.3% decline in September. The preliminary reading on Consumer Sentiment from the University of Michigan also bodes well for the holiday season as it shot up to 89.4 from October’s final reading of 86.9.
There is a full economic calendar this week with the Empire State Manufacturing and Industrial Production on Monday followed by the Producer Price Index as well as the Housing Market Index on Tuesday.
On Wednesday we get the Housing Starts, and then later in the day, the release of the most recent FOMC minutes, which often moves the markets. In addition to the jobless claims on Thursday, we get the Consumer Price index, PMI Manufacturing Index, the Philadelphia Fed Survey, and Existing Home Sales.
What to Watch
The stock market stayed amazingly strong last week, and as I noted last Thursday in Don't Fear a New Nasdaq High, the bullish sentiment according to AAII jumped to 57.93%, up from 52.93%. The prior week’s high level of bullishness was one of my three reasons not to jump in the market now.
The market-tracking ETFs are still a high risk at current levels since one would need to use a fairly wide stop in order to ride out a correction. If, instead of correcting, the market traces out a broader trading range then the risk management will become easier.
I will continue to favor the small-cap stocks for the last six weeks of the year as the four I recommended in 4 Small-Caps with Bullish Monthly Volume have not yet reached their buying zones.
In the most recent trading lesson, I took a look at the four sector ETFs that—over the past fifteen years—perform the best in the last two months of the year. Three of them will look attractive for new purchase if we get a correction or some consolidation so an entry point can be better defined.
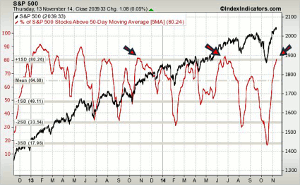
The overall market continues to get more overbought as, for the S&P 500, the 5-day MA of the number of stocks above their 50-day MAs was 80.24% last Thursday and is now very close to the June 2014 and October 2013 highs (see arrows). It is now one standard deviation above the mean at 64.68%.
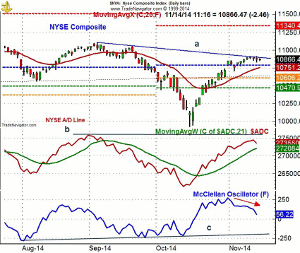
The NYSE Composite (NYA) is still bumping into the chart resistance, line a, in the 10,900 area. It is still well below the July highs at 11,108. The NYSE remains above the quarterly quarter pivot at 10,789, but has made little upward progress over the past six days.
The daily starc+ band is still at 11,045 with the quarterly projected pivot resistance at 11,340.
The rising 20-day EMA has risen now to 10,751 with initial quarterly pivot support at 10,606. The quarterly projected pivot support at 10,470.
The daily NYSE Advance/Decline line made a new high last week but turned down on Friday. It is still above its rising WMA but the gap has narrowed. Still, it shows no signs yet of a top.
The McClellan oscillator has continued to deteriorate as it has now dropped to +56 (see arrow). On a further correction, it could drop down to the -100 to -150 area.
NEXT PAGE: Stocks
|pagebreak|S&P 500
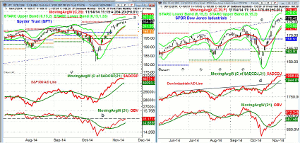
The Spyder Trust (SPY) is also edging close to the resistance, line a, in the $205-$205.60 area. The daily starc+ band is now at $207.01 with the monthly projected pivot resistance at $207.70.
The range last week was narrow with a high of $204.83 and a low of $203.13. This low now represents first support with the 20-day EMA at $200.85. There is more important support at $200 with the monthly pivot at $195.13.
The S&P 500 A/D line made another new high last week and is well above its rising WMA.
The daily on-balance volume (OBV) is back to the resistance from the August and September lows, line b. The weekly OBV (not shown) may close the week back above its WMA, which would be a positive sign.
Dow Industrials
The SPDR Dow Industrials (DIA) was able to surpass the resistance, line c, that connects the July and September highs. The daily starc+ band is at $178.50 with the quarterly pivot resistance at $179.48.
The daily Dow Industrials A/D line made additional new highs last week after breaking through longer-term resistance, line d, in late October.
The daily OBV has moved further above its rising WMA but is still well below the September highs. The weekly OBV (not shown) is still below its flat WMA and will look weak with a negative close this week.
Nasdaq 100
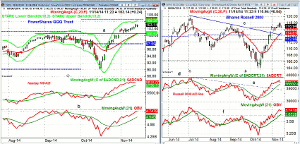
The PowerShares QQQ Trust (QQQ) acted the best last week as it moved well above last week’s doji high. The daily starc+ band is at $104.07 with the weekly just a bit lower. The quarterly projected pivot resistance is at $104.74.
There is first support now at last week’s low of $101.38 with further at $100.67, which was the doji low. The rising 20-day EMA is now at $100.31 with the September high at $100.56. The quarterly pivot is at $97.59.
The daily Nasdaq 100 A/D line flattened out last week but is very close to the recent highs. Over the past two weeks, it has come much closer to its WMA.
The daily OBV did make further new highs last week and is now quite close to the long-term resistance at line b. This corresponds to the September highs and a move above this level is needed to confirm the price action.
Russell 2000
The iShares Russell 2000 Index (IWM) closed the week on the lows and closed lower. The daily chart suggests that prices may have been consolidating over the past two weeks. The IWM has been holding above the quarterly projected pivot resistance at $116.58.
The daily starc+ band is at $120.08 with the monthly projected pivot resistance at $121.17.
The daily Russell 2000 A/D has performed well after breaking its downtrend, line e. It is now getting closer to the major resistance from July at line d. The A/D line did turn down on Friday.
The daily OBV made another new high last week and acted stronger than prices. It has long-term resistance at the early July highs with support at line f.
There is two week support now at $115.28 with the rising 20-day EMA at $114.81. The quarterly pivot is at $112.95.
NEXT PAGE: Sector Focus, Commodities, and Tom's Outlook
|pagebreak|Sector Focus
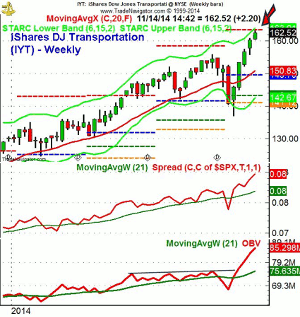
The iShares Dow Jones Transportation (IYT) made further new highs last week as it reached the quarterly projected pivot resistance at $163.49. It also came very close to the weekly starc+ band at $163 (see arrow).
The weekly relative performance analysis made significant new highs again last week as the Transports continue to be a market leading sector.
The weekly OBV also has made impressive new highs and is acting stronger than prices. This is a sign that a pullback in IYT will be a buying opportunity.
There is short-term support now in the $160 area with the rising 20-day EMA and daily starc- band in the $158 area.
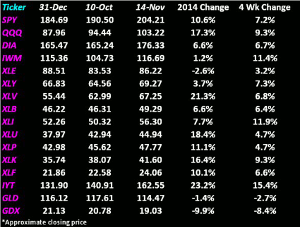
While the Select Sector Health Care (XLV) held up well last week, the Select Sector Utilities (XLU) gave up 3% and is now just up 18.4% for the year.
For the year, the PowerShares QQQ Trust (QQQ) is now up 17.1% with the Spyder Trust (SPY) sill up over 10%.
The Select Sector Technology (XLK) has gained 16.4% and has moved further ahead of the Select Sector Financial (XLF) which is up 10%.
The SPDR Dow Industrials (DIA) and the Select Sector Materials (XLB) are both up 6.5% for the year. It has a tendency to outperform the S&P 500 for the last two months of the year.
Interest Rates
The yield on the 10-Year T-Note was a bit higher last week in reaction to the Retail Sales data. Yields are still in a downtrend, but there is plenty of economic data and the FOMC minutes this week for the bond market to digest.
Precious Metals
The SPDR Gold Trust (GLD) and Market Vectors Gold Miners (GDX) had nice gains on Friday with the GDX up over 6%. This has turned the short-term outlook positive, but the weekly analysis is still negative, though bearish sentiment is high.
The Week Ahead
The market was a bit soft on Friday, but not enough to signal that a correction was underway. The market’s reaction to the first sharp down day will be important, but for those not invested, I still think now is the time to keep your power dry.
I always encourage traders and investors to do their own research and now is a good time to work on your buy list. If we do get a meaningful correction, it should be a good time to be a more aggressive buyer.
I would not change the strategy for long-term investments unless you are considering increasing the stock portion of your portfolio at lower levels. The dollar cost averaging positions should be held as I do expect stocks to be higher in the first quarter of 2015 and even your patience in the EuroZone markets should be rewarded.
I will continue to look for new opportunities in the small-cap stocks, especially in the consumer discretionary stocks as I expect to see stronger consumer buying in the weeks ahead.
Be sure to monitor my Twitter feed for up-to-date changes in the market outlook as well as recommendations before the opening.
Don't forget to read Tom's latest Trading Lesson, Will the Seasonally Strong Sectors Perform?

