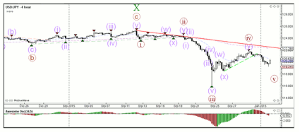
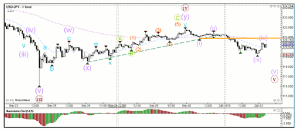
The staff at Admiral Markets uses technical analysis to examine the price action of three major currency pairs and points out the levels at which a break above resistance or below support could trigger more momentum.
Currency Pair EUR/USD
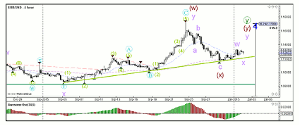
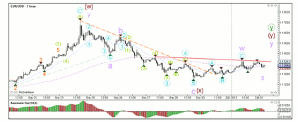
The EUR/USD has bounced at the support trend line (green) but the rebound has been relatively slow, which has created a triangle. A break above resistance (red) or below support (green) could trigger more momentum.
The EUR/USD completed an ABC rally (purple) after breaking above resistance (orange). After that it made a deep pullback which probably belongs to a bigger bullish correction like a wave X retracement (purple).
Currency Pair GBP/USD
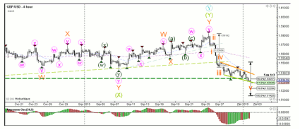
The GBP/USD price action is captured by a neat downtrend channel but it has reached the 61.8% Fibonacci target of wave 5 (orange). A break above resistance (orange) or below support (green) could trigger more momentum.
Divergence is still present with the recent break of the bottom (purple).
Currency Pair USD/JPY
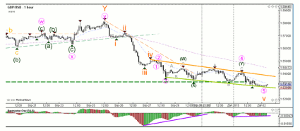
The USD/JPY had a strong bullish rebound which increases the chance of wave 5 (dark red) failing to break the bottom, especially when one considers the big wick on the bottom of the last week's weekly candle.
A break of the resistance (orange) indicates that a wave (blue) is invalidated. The alternative is a corrective wave pattern or a truncated wave 5 (failure to break the bottom).
By the staff of Admiral Markets

