Since four key indicators are the ones a lot of institutional traders look for before buying a specific stock, Federico Flom, on BigTrends.com, details each of these clues for the benefit of all traders because knowing the optimal time to buy or sell a stock is a valuable skill any trader can and should learn.
Some of history's greatest hedge funds and portfolio managers combine fundamental analysis with timing the entry/exit using technicals to pick opportunities. This is how managers like Paul Tudor Jones, John Henry, Louis Bacon, and others have operated.
In this post I will detail four different clues that hedge fund traders look for before they buy a stock and even before those stocks start moving up. First of all, we've all heard the saying, "timing is everything." This is just as true in the stock market as it is in life. Knowing the optimal time to buy or sell a stock is a valuable skill anyone can learn and should learn. I think that charts are essential because they communicate critical information about how a stock is acting in the marketplace; information you would miss by concentrating on fundamentals alone. Charts allow me to identify current stock behavior in relation to a stock's recent history and the overall market action. I have seen a lot of both institutional and individual investors lose a lot of money if they don't know how to recognize when a stock tops and starts into a significant correction or if they have been depending on someone else who also doesn't know this.
Millions are made every year by those who take the time to learn to interpret charts properly. Professionals who don't make use of charts are confessing their ignorance of highly valuable measurement and timing mechanisms. From my years trading equities—and my conversation with several traders in hedge funds—I have seen that there are four main technical signals that professional traders look for before buying stocks:
Relative Strength
One friend who was a proprietary trader at Goldman Sachs told me that the most important technical aspect they looked at the desk was how the stock moved in relation to the overall market. He was looking to buy stocks that didn't go down during market corrections because that same stock will explode as soon as the overall market normalizes.
Relative strength is one key technical indicator that shows you what value the market itself places upon a stock. In other words, how is a stock price acting in relation to the market and all other stocks. Many fundamental securities analysts think that technical analysis means buying those stocks with the strongest relative price strength. Others think that technical research refers only to the buying of high momentum stocks. Both views are incorrect.
The key in analyzing relative strength is identifying when a stock is acting better than the overall market and to identify if that action is normal or abnormal in relation to the stock history in order to buy the stock as it emerges from a consolidation period. To measure relative strength from some days price action won't be enough, you need at least a month to really identify that the stock is truly behaving better than the overall market and is evidence that institutional buyers are silently accumulating the stock. Take a look at one example:
NEXT PAGE: Fast Casual in Motion
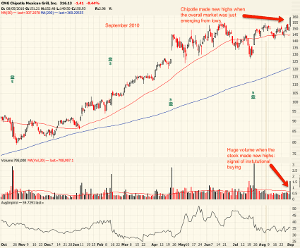
|pagebreak|In 2010, after Bernanke announced the launch of QE2, the market rallied almost 15% from lows. One of the best performing stocks from that rally was Chipotle Mexican Grill (CMG) that went up 70% in just 90 days. The fact (among others) that made Chipotle look different than the rest of the stocks was its superb relative strength. While the market was just emerging from lows at the start of September 2010, CMG was close to new highs. As soon as the market started going up decisively, CMG broke new highs with huge volume and started a nice 70% move in just some weeks. This was one of the best performing stocks in 2010.
CMG Chart
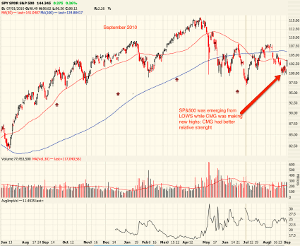
While CMG was about to break new highs, the S&P 500 (SPY) (SPX) was just coming from lows. It was evident that CMG was stronger than the overall market and as soon as investors started buying stocks, CMG was one of the fastest stocks to rise.
SPY Chart
Volume Clues
The law of supply and demand is rampant in the marketplace. Stocks never go up in price by accident, there must be large buying demand. Most of this demand comes from institutional investors, who account for more than 75% of buying of the better quality leading stocks. When you are selecting stocks, daily or weekly trading volume is how you measure demand.
Volume is the actual number of shares traded daily. Another clue that top traders look for before buying a stock is the occurrence of big daily and weekly volume spikes. Weeks of advancing prices of heavy volume, followed in other weeks by extreme volume dry-ups or lack of distribution is a very constructive sign. Volume is a remarkable subject that is worthy of careful study. It can help you recognize whether a stock is under accumulation (institutional buying) or distribution (institutional selling). Big volume at certain key points is indispensable. Those key points are specific prices that institutional traders buy the stock. Those traders are looking at huge volume increases the day that the stock passes that specific price or trend line. Volume is the best measure of supply and demand and institutional sponsorship.
The next time you consider buying a stock check its weekly volume. It's usually constructive to see that the number of weeks that the stock closes up in price on above than average weekly volume outnumbers the number of weeks that it closes down in price on above average volume. Take a look at one example:
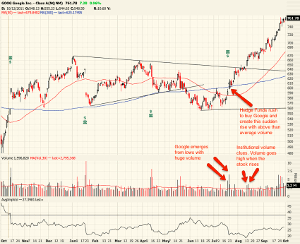
Google (GOOG) was trading near its low range of $570/580 until August 2012. When the stock reported strong earnings, institutional buyers rushed to buy the stock. This created an abnormal and decisive rise with increased volume. This is the type of movement than gives evidence of institutional buying. It is essential to look this at the start of a move. Google started moving up from its lows and made that move with above than average volume and decisive price action. This is evidence that hedge funds started looking at this stock.
GOOG Chart
Volatility Contraction or Tight Trading
Volatility contraction or tightness is defined as small price variations from high to low for the week, with several consecutive weeks prices closing unchanged or remarkably near the previous week close. Tight trading is an important element of market action. Essentially, when a stock has been quiet for a period of time it means that institutions has been silently accumulating stocks and it could be ready to move as soon as it clears that price inaction. Why this happens?
NEXT PAGE: Price Expansion and Price Contraction
|pagebreak|In general, price expansion tends to follow periods of price contraction, the phenomenon being cyclical. The market alternates between periods of rest or consolidation and periods of movement, or markup/markdown. Volatility is actually more cyclical than is price. When a stock consolidates, buyers and sellers reach an equilibrium price level and the trading range tends to narrow. When new information enters the marketplace, the stock moves away from this equilibrium point and tries to find a new price or value area. Either longs or shorts will be trapped on the wrong side and eventually forced to cover, aggravating the existing supply/demand imbalance. That is why institutional traders wait for that move to occur before they buy the stock. Take a look at one example.
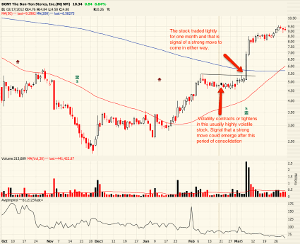
From February to March 2012 Bon Ton stores (BONT) traded in a very tight range. Volatility contracted in comparison to BONT normal volatility levels. That indicated that bulls and bears were in balance and as soon the company reported something good that equilibrium will be broken and bulls will appear in masse. Buying BONT the same day the stock started moving out from that tight range period was a good trade.
BONT Chart
Solid Trend Line Formation or Consolidation
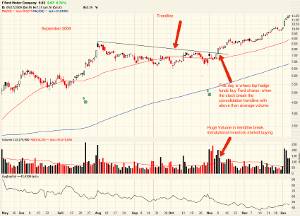
After the research team of a hedge fund analyzed an opportunity they give that to the trading desk in order to buy that opportunity at the right time. What a top trader will do is wait that the stock goes down and consolidate in price before he buys. He will look at the chart and try to identify the trend line of that consolidation because that trend line is a solid indicator of entry/exit from that trade. In other words, if he wants to buy Apple shares, he will wait that Apple goes down in price, stabilize, and after several weeks the shares start going up again with increased volume breaking a solid trend line from that consolidation. The case of Ford (F) in 2009 explain this:
Ford shares consolidated from months, neither going up nor down in that period. When that happens, the stock creates a trend line that traders use as a point of entry in the stock. Hedge funds traders wait for the stock to break that trend line with increased volume because that is a strong evidence that a huge potential move could start. Good traders never buy on the way down hoping that in some day the stock will go up. They wait until there is a strong confirmation that the stock broke a specific level with increased volume, giving them the best risk/reward picture. Those entry points are created by using trend lines.
F Chart
Conclusion
I think it is essential to master both fundamentals and technicals. Fundamentals are important to pick investments while technicals help me time the entries/exits in order to reduce risk and invest with some momentum.
There are many tools that traders use to evaluate opportunities but these four indicators are the ones that a lot of institutional traders look for before buying a specific stock.
By Federico Flom, Contributor, BigTrends.com

