
Money is flowing into precious metals and the price action is strong. It looks like a classic "flight to safety" that should have some legs, explains Moby Waller, editor of Daily Profit.
The possible reasons for this move are myriad: among them are global uncertainty from the new Trump administration, China and India currency and political fluctuations, and U.S. dollar and interest rate expectations.
What is the best way to profit from further moves in the yellow and silver metals? The gold and silver miners are achieving the best gains. These companies are leveraged to gains in the underlying commodities.
And the best way to play this group is through a basket of stocks in an ETF, in my analysis. This lessens the overall volatility and risk compared to an individual company.
My favorite ETF among this group is not widely known . . . yet. It is PureFunds ISE Junior Silver ETF (SILJ), which holds a basket of small-cap silver mining and exploration companies.
The ETF has holdings in 25 stocks currently, with the top three holdings representing about 41% of its total assets. Those largest holdings are in Pan American Silver (PAAS), Coeur Mining (CDE) and First Majestic Silver (AG).
This ETF simply gives the biggest bang-for-the-buck on rallies in the precious metals.
I looked at relative performance over multiple recent time frames: since the December bottom in gold, year-to-date and since the S&P 500 peaked recently on Jan. 26.
SILJ is outperforming GLD, SLV, Gold Miners ETF (GDX), Junior Gold Miners ETF (GDXJ) and Silver Miners ETF (SIL) over all of these time periods.
And in my analysis, SILJ can achieve potential further gains of 30%+ this year, or even sooner. Take a look at the SILJ Daily chart below.
This chart contains the unique, tested indicators I utilize for trading sectors - the 24-day and 82-day Exponential Moving Averages (Exp MA) and Stochastics, which is an oscillator I use to measure the strength of the price action.
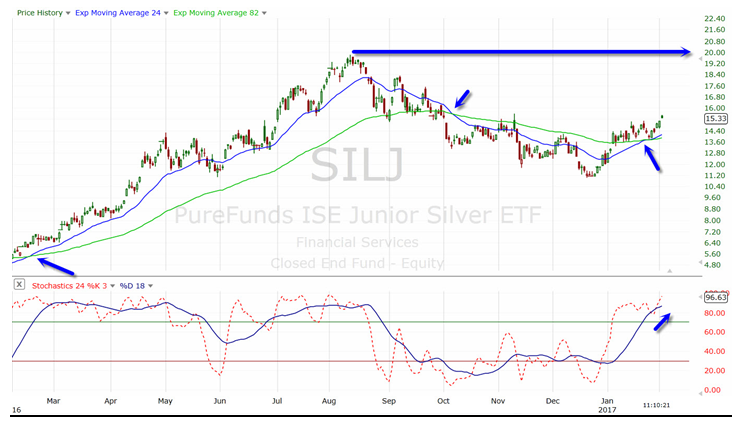
You can see above the SILJ recently had a bullish crossover of the faster-moving average above the slower one. The two previous crossovers of these key Exp MAs were good directional triggers in both directions.
Notice that SILJ is now trending along and holding support from its faster Exp MA on any pullbacks; this is a sign of strength and bullish price action.
At the bottom of this chart you can see that both the faster and slower Stochastics are also giving a strong reading above the 70 bullish threshold.
My current upside target on SILJ from here is the $20 area, which was a key high reached in 2016. However, if you notice the giant rally this ETF had from last February to until August (from around $5 to around $20).
There is big further potential upside if this rally shows some serious legs. Breaching the $14 or $13 levels would likely be triggers to exit the ETF on a stop-loss.


