
Click
to Enlarge
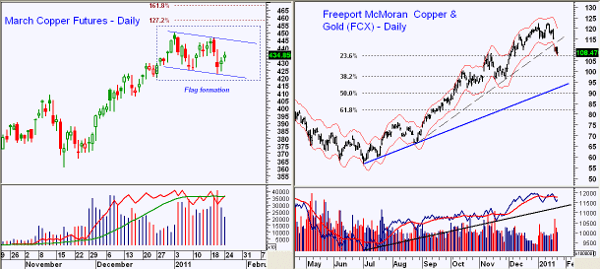
Chart Analysis: The inflationary fears around the world have caused several countries to raise rates, and this has put the focus on many of the commodity markets, including copper.
The chart of the March Comex copper futures shows what appears to be a classic flag formation. This is a continuation pattern, or a pause in the dominant trend, which for copper is still positive.
- Flag formation is 12 cents wide, so on a move above 446.75, the upside targets are at 458-460. 127.2% Fibonacci target also at 458
- Volume analysis is positive, including the on-balance volume (OBV)
- Initial support is at 422-423 with major support in the 408-410 area
Freeport-McMoRan Copper & Gold (FCX) was hammered last week, and even though earnings beat estimates, the guidance going forward and a few analysts’ downgrades pressured the stock. So what’s next?
- FCX gapped through its initial uptrend and the longer-term uptrend is at $93
- The 38.2% support is at $98 with the major 50% retracement support at $90
- Daily and weekly volume analysis is still positive, as there are no negative divergences like there were in April 2010
- FCX is now at the daily starc- band and is therefore oversold, which increases the odds of a short-term rebound
- Any rebound will find resistance at $113-$115
What It Means: The analysis of the copper futures is consistent with a continuing economic rebound. It also suggests that we may not see any immediate impact on commodity prices—like copper—if more countries raise rates because of inflation fears.
How to Profit: By looking just at copper prices, it suggests that the economic recovery may actually live up to current expectations. However, given the 20% gain over the past three months, the copper futures only look attractive for short-term traders.
Last week’s sharply lower opening in FCX did some technical damage, which favors further weakness over the next few weeks, if not a couple months. The correction in FCX from the April highs lasted until July. Look for signs that FCX is bottoming in the $90-$98 area before taking a new position. My negative technical view on gold will add additional pressure on FCX.
Tom Aspray, professional trader and analyst, serves as senior editor for MoneyShow.com. The views expressed here are his own.


