
Latest sector analysis shows that consumer staples and health care could be the new star performers. Also keep an eye on energy and technology, and avoid lagging financials.
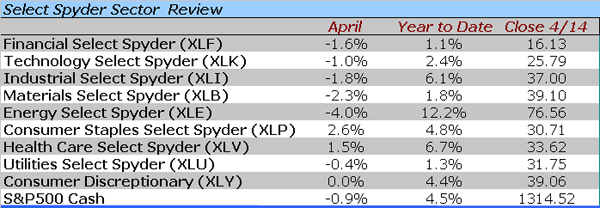
The main market averages have declined steadily since early April, as the S&P 500 is down 1% for the month and is almost 2% below the highs. The selling has been selective, however, as some sectors have clearly bucked the trend and are outperforming the major averages.
Click to Enlarge
The Energy Select Sector SPDR (XLE) is still the leader for the year, up 12.2%, but even it is down 4% so far this month.
The Consumer Staples Select Sector SPDR (XLP) and Health Care Select Sector SPDR (XLV) are clearly the leading sectors as we start the year’s second quarter, as they are up 2.6% and 1.5% so far in April, respectively.
At the end of the first quarter, I focused on three sectors that I liked and one that I didn’t (see “Best Q2 Sectors to Buy”). Though I have liked health care and XLV since mid-January, consumer staples and XLV were not on my radar, but clearly, these two sectors should be the first to look at for new stock purchases.
On the other end of the spectrum, the technical outlook for the Financial Select Sector SPDR (XLF) continues to deteriorate, making this a sector we should continue to avoid for now.
Click to Enlarge
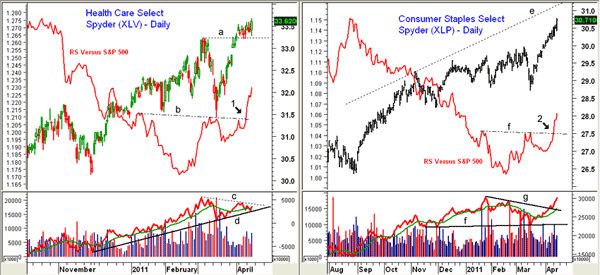
Chart Analysis: The Health Care Select Sector SPDR (XLV) broke out to new highs in early April as it surpassed the March resistance (line a) at $33.25 and has held above this level while the overall market has corrected.
- The daily chart shows more important support now in the $32.30-$32.70 area with major support at $31.50
- The relative performance, or RS chart, measures how a stock or ETF is performing relative to the S&P 500. For XLV, we can see that it turned up in February and completed a bottom formation on Monday (point 1) as it broke through resistance at line b
- The daily on-balance volume (OBV) has turned up from support at line d, but has not yet moved to new highs
- The 2008 highs in XLV are at $33.70, and above that, I have further targets in the $36.50-$38 area
The rally in the Consumer Staples Select Sector SPDR (XLP) from the March lows has been impressive, as XLP has gained almost 7%. So far in April, it has outperformed the S&P 500 by 3.5%.
- The long-term upper trend line resistance, line e, is currently at $31.20, and the 2008 highs at $29.29 have been exceeded
- The RS analysis for XLP shows a similar formation having just moved above the key resistance at line f, which confirmed that XLP was outperforming the S&P 500 (point 2)
- The daily OBV has moved through resistance (line g) after holding long-term support in March, line f
- XLP is overextended in the short term with first good support at $30-$30.20 and much stronger support at $29.50
NEXT: See Latest Chart Action for Technology and Financial Sectors
|pagebreak|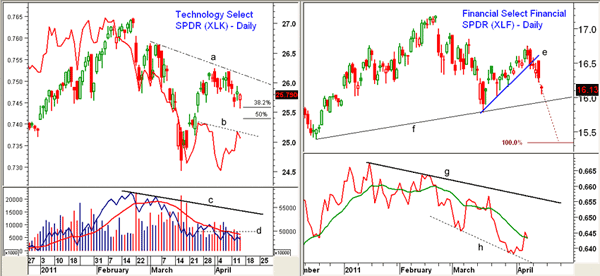
Click to Enlarge
The Technology Select Sector Spyder (XLK) has been a lagging sector since the March lows. The sentiment on this sector seems quite negative, and Google’s earnings reported after the close on Thursday won’t help. If GOOG trades below $350—as in did in afterhours trading—it will violate key support, and XLK has a 5.7% position in GOOG.
- The daily chart shows that the 38.2% support level has been reached with the 50% support at $25.40. A break below the $25-$25.11 level would suggest a test of the March lows
- The RS analysis shows well-defined resistance (line b), which, if overcome, would be a positive for the sector
- The daily OBV is still negative but has not shown any heavy selling pressure so far. The weekly OBV did confirm the February highs, which is a positive for the intermediate term
- There is short-term resistance now at $26 (line a) and a close above this level would stabilize the short-term outlook. More important resistance is at $26.66
As noted last week, the Financial Select Sector SPDR (XLF) closed below its short-term uptrend, line e, which completed what appeared to be a continuation pattern.
- XLF closed at next support in the $16-16.10 area. A decisive break of this level would project a decline to the $15.40 area. This would equal the prior decline (100%).
- The RS analysis formed lower highs in February which identified this sector as an underperformer. It has been weaker than the S&P 500 for the past few months as the RS has formed lower lows, line h.
- It would take a move in the RS above its downtrend, line g, to turn it around.
- XLF has first resistance now at $16.50-60 and a close above $16.75 is needed to suggest that this sector has stabilized.
- The daily OBV (not shown) continues to be weak and show no signs yet of bottoming.
What It Means: The action in the first half of April suggests that consumer staples and health care may turn out to be the star sector performers for the next few months. Concentrate on these two sectors for new stock purchases, though I still like energy and am looking for a turnaround in the tech sector.
How to Profit: It is difficult to see a good entry point in either XLP or XLV due to their recent strength. On April 1, I recommended buying XLV at $32.10-$32.68, but it never got below $33.23.
In the next week, I will be looking at some individual stocks in these two sectors where the risk can be better controlled, and if my analysis is correct, the stocks in the sectors should perform better than the corresponding ETFs.
Portfolio Update
In the early-April report, I also recommended re-buying XLE at $76.44-$77.07, which was filled this week once the low hit $75.30. Keep the stop at $72.72. A close back above $78.50 is needed to stabilize the short-term outlook.
I also recommended buying XLI at $36.30-$36.74, and the low on Thursday was $36.47. On long positions, use a stop at $34.92. On a move above $38.14, raise the stop to $36.27, and sell half the position at $39.42.


