The charts flashed a clear warning sign before gold’s recent decline, and while the mid- to long-term trend remains positive, it’s time to hedge existing long positions.
Longtime readers know that Starc bands are among my favorite technical tools. Still, last Thursday’s column on gold, where I pointed out that risk on the long side was uncomfortably high, was treated with a fair amount of skepticism, as some were looking for the $2000 or $2500 level to be reached before a correction began.
In that article, I pointed out that as gold was accelerating to the upside, the bearish analysts had disappeared. More importantly, the SPDR Gold Trust (GLD) was trading above both the monthly and weekly Starc+ bands. Historically, this was a very rare occurrence.
As I noted at the time, “When a market reaches a historically high-risk buying area using both the weekly and the monthly analysis, the odds of some consolidation or a more significant pullback are very high. From a money management point of view, this can allow even long-term investors to protect profits by hedging their positions.”
Given the parabolic nature of the recent rally, the correction could last for some time, but it is important to remember that the intermediate and long-term trends are still positive for gold. For those who are not accustomed to gold’s volatility, you may want to take a look at past gold corrections, as detailed in “Are You Ready for Gold’s Volatility?”
Gold futures are down another $35 in early trading on Thursday, so GLD could lose another 2.2% on the opening. The key Fibonacci retracement and chart support levels can help identify the key levels investors and traders should be watching.
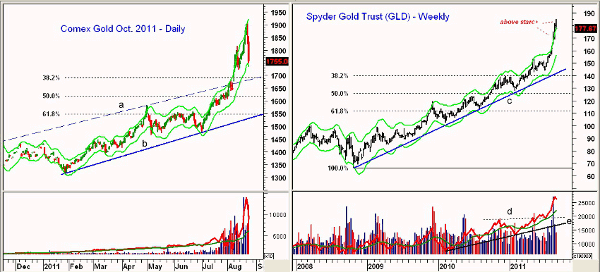
Chart Analysis: Whether investing or trading one of the gold ETFs or buying physical gold, it is important to keep an eye on the gold futures. The daily chart of the October Comex gold contract had been exceeding the daily Starc+ band for the three days prior to yesterday’s drop.
- The daily Starc- band was tested on Wednesday with the 38.2% Fibonacci retracement support and trend line support (line a) in the $1690-$1700 area. This is just $55 below Wednesday’s close
- The more important 50% support is at $1620 with converging retracement support (61.8%) and the daily uptrend (line b) in the $1550 area
- Volume was relatively heavy on Wednesday, but the daily on-balance volume (OBV) is still above its weighted moving average (WMA). The weekly OBV (not shown) made new highs last week
- There is initial resistance for the futures at $1825-$1850
The weekly chart of the SPDR Gold Trust (GLD) shows it has been trading above the weekly Starc+ bands for the past three weeks, a clear “red flag” warning sign. The weekly Starc- band is currently at $156.
- The major Fibonacci support levels derived from the 2008 lows are identified on the chart with the 38.2% support at $140
- The long-term uptrend, line c, is a bit higher at $142.50
- The major 50% support is much lower at $126
- The weekly OBV made new highs last week, which is bullish for the major trend. It has broken through resistance (line d) in May and is well above its WMA
NEXT: See Key Downside Targets for GLD
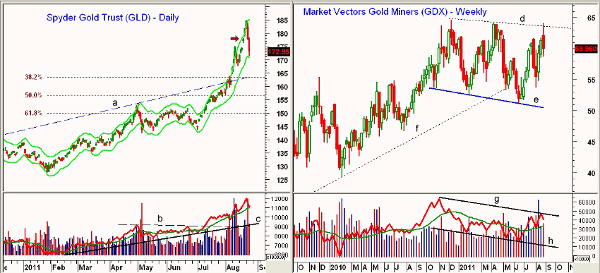
|pagebreak|The daily chart of the SPDR Gold Trust (GLD) shows Monday’s close above the daily Starc+ band and the subsequent test of the Starc- band on Wednesday.
- The minor 38.2% Fibonacci retracement support is at $163, which is calculated from the lows on January 27, 2011
- This also coincides with the trend line support (line a) that is drawn from the November 2010 and May 2011 highs
- The 50% retracement support is at $156.30 with the 61.8% support at $149.60
- The daily OBV is already back to its weighted moving average, but could retest the breakout level (lines b and c) before the correction is over
- There is initial resistance now at $178-$183
The gold miners have gotten quite a bit of attention lately as the Market Vectors Gold Miners ETF (GDX) was trying to break out above weekly resistance, line d, in the $64.12-$64.62 area. Depending on where we close the week, it could be a breakout failure.
- The weekly uptrend, line f, that goes back to the 2009 lows, was broken earlier this summer and may have been giving an early warning signal
- There is initial support now at $58.60, and a close below this level would be the first sign of a breakout failure. A close below $54.40 would be more negative
- The lower boundary of the weekly trading range (lines d and e) is in the $50.40 area
- The weekly OB V has formed lower highs, line g, despite the high volume a few weeks ago. It is still above its rising weighted moving average
- The lower lows in the OBV, line h, are also a concern
- A weekly close above last week’s highs at $61.76 is needed to improve the technical outlook
What It Means: The data from the futures market suggests that the hedge funds are holding most of the longs. Though some hedge funds are facing redemptions and may need to sell, it would be more negative if the small speculators were too bullish.
If prices close sharply lower again on Thursday, it would increase the odds of a decent rebound in the next week or so. The most likely eventual downside targets for GLD are in the $163-$156.60 area. The December gold futures should find good support at $1625-$1650 with more important support at $1550.
Given the severity of the recent drop, a rally back to the highs is possible, but I do not think that is likely. Given the weekly and monthly analysis, I would not recommend shorting gold or gold ETFs.
How to Profit: Those who are long GLD and have not hedged their positions need to have a plan now, if they don’t already. Shareholders need to decide whether they are willing to hold their positions through a decline to the target levels noted above or whether they want to either lighten or hedge their positions on the next rally.
If GLD gets down to the $165 area on the current decline, then a rally back to the $175-$178 area would not be surprising.


