Traders and investors looking to capitalize on the bullish outlook for the oil market should consider these two stocks, which show favorable chart patterns and are close to staging upside breakouts.
Stocks have had a fairly choppy week, which makes the weekly close more important. A higher weekly close will be a positive sign, and the very strong action in crude oil on Thursday is a bullish signal for stocks.
As discussed previously, crude oil futures often break up or down ahead of the stock market. Wednesday’s heavy selling in stocks increased the possibility of a deeper stock market correction, and while crude oil was also lower, it made new rally highs on Thursday.
The crude oil market is suggesting that the US economy is stronger than most economists believe. This and a turnaround in the emerging markets would signal a sharp uptick in demand and a further surge in prices.
As a result, energy stocks or ETFs should be part of your portfolio. These two stocks are close to completing reverse head-and-shoulders bottom formations and have good upside potential.
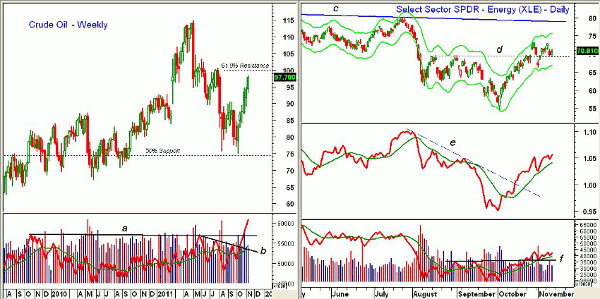
Chart Analysis: The weekly chart of crude oil shows the powerful rally from the early-October low as crude oil held above the major 50% retracement support.
- The close above the September highs on October 24 completed the double-bottom formation
- Crude oil has next key resistance in the $100 area, which is the major 61.8% retracement level
- Once this level is overcome, there are further targets in the $104-$106 area
- The weekly on-balance volume (OBV) broke through its short-term downtrend, line b, ahead of prices. This was followed by a move through major resistance, line a, two weeks later
- There is now initial support at $93-$94.50 with stronger support in the $90 area
The Select Sector SPDR - Energy (XLE) has just pulled back to retest the breakout level at line d. There is key support at $66.34, which was the November 1 low.
- On a move above the recent highs at $73.17, there is further resistance in the $74-$75 area and the daily Starc+ band
- The longer-term trend line resistance is at $78-$79, line c
- The relative performance, or RS analysis, broke its downtrend, line e, on October 18. The RS is above its moving average and both are rising nicely
- The weekly RS (not shown) is above its weighted moving average (WMA) but has not yet broken out above major resistance
- The daily on-balance volume (OBV) completed its bottom formation when it moved through resistance at line f
- The weekly OBV (not shown) is testing its moving average and needs a higher weekly close to complete its bottom formation
NEXT: 2 Oil Stocks with Bullish Momentum
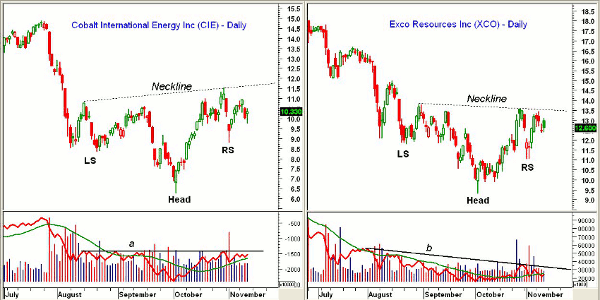
|pagebreak|Cobalt International Energy, Inc (CIE) is a $4 billion oil drilling and exploration company that hit a low of $6.30 on October 4. CIE traded as high as $17.22 in April.
- The daily chart shows the formation of a reverse head-and-shoulders bottom formation with the left shoulder (LS) having formed in August and the head in October
- The sharp drop on November 1 and the low of $8.80 is tentatively labeled as the right shoulder (RS)
- Though there was a volume spike at the right shoulder, the overall volume was highest going into the left shoulder and was lower at the head and RS
- This is the volume pattern that one would expect to see in a reverse H&S bottom
- The daily OBV has corresponding key resistance at line a. The weekly OBV (not shown) is positive
- A close above the neckline at $11.65 would complete the formation and give upside targets at $16.65
- Minor support now stands at $10 with stronger support at $9.40-$9.60
EXCO Resources, Inc. (XCO) is a $2.7 billion independent oil and natural gas company that spiked to a low price of $9.33. It traded at over $21 earlier in the year. The daily chart of XCO looks quite similar to that of CIE.
- The neckline of the reverse H&S bottom formation is at $13.55
- The right shoulder low at $11.07 is quite a bit lower than the left shoulder at $11.81, but that often happens
- A close above this level (preferably on strong volume) will give upside targets in the $17.80 area
- The daily OBV is still in its downtrend, line b, while the weekly OBV (not shown) did form a positive divergence at the October lows
- There is initial support at $12-$12.40
What It Means: Crude oil’s action and the fact that the Advance/Decline (A/D) lines have turned up nicely suggests that Wednesday’s drop was just to shake out some weak longs. On Wednesday, I allowed for a deeper correction if the Spyder Trust (SPY) violated the support at $122.78, but the low was $122.86.
A higher close for the week should set the stage for a push to the upside in the next week, and these two energy stocks are expected to participate. Though I generally do not advocate anticipating the completion of chart formations, for these two stocks, the risk/reward seems favorable.
How to Profit: For Cobalt International Energy, Inc (CIE), buy at $10.18 with a stop at $9.29 (risk of approx. 8.7%). On a move above $12, raise the stop to $9.90.
For EXCO Resources, Inc. (XCO), buy at $12.31 with a stop at $11.36 (risk of approx. 7.7%). On a move above $14, raise the stop to $11.86.
For the Select Sector SPDR - Energy (XLE), buy at $69.24 with a stop at $65.56 (risk of approx. 5.3%).
Our earlier recommendations to buy the United States Oil Fund (USO) and Sunoco Inc. (SUN) were not filled and those orders should be cancelled at this time.
Previous buyers of Noble Corp (NE) should be long at $29.56. Raise the stop from $27.08 to $32.90.


