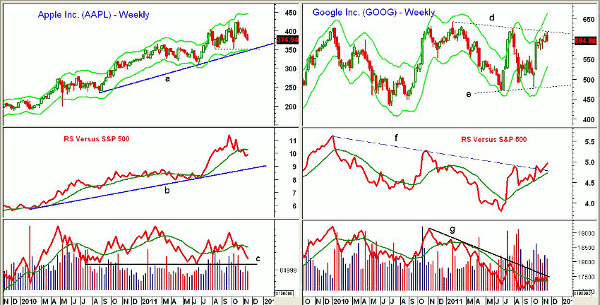
Recent weakness in tech titans like Apple (AAPL), Google (GOOG), and Amazon.com (AMZN) has gotten plenty of attention, and the charts indicate that further declines could be in store.
Last week was clearly a rough one for stocks, and weekend reports that the Congressional supercommittee has reached an impasse are pushing stocks sharply lower in early-Monday trading. The Nasdaq 100 was one of the weaker market averages, down 4.3% versus 3.8% in the S&P 500. The Dow Jones Industrials were down just 2.9%, as was the small-cap S&P 600.
The weakness in some of the largest tech stocks has many wondering whether the whole tech sector is in trouble or if the weakness in just a few stocks is artificially depressing the Nasdaq 100.
Together, Apple Inc. (AAPL), Google, Inc. (GOOG), Amazon.com (AMZN), and Salesforce.com (CRM) make up 30% of the PowerShares QQQ Trust (QQQ). A closer look at the weekly technical outlook for these key stocks will help us identify the next downside targets and whether any good buying opportunities may be around the corner.
Chart Analysis: Apple Inc. (AAPL) has had a rough couple months given the passing of Steve Jobs and mixed opinions on the launch of the new iPhone. Despite all this, AAPL is only down 12.9% from the July highs.
- The weekly chart shows strong converging support in the $350 area, which corresponds to the uptrend (line a), the weekly Starc- bands, and the lows of the past few months
- There is longer-term support from June in the $310 area
- The weekly relative performance, or RS analysis, has dropped below its weighted moving average (WMA) and did form a slight negative divergence at the recent highs. It is still well above its longer-term uptrend, line e
- The daily RS analysis (not shown) is still negative
- The weekly on-balance volume (OBV) dropped below its weighted moving average in late October and is getting closer to long-term support at line c
- Initial resistance for AAPL is at $391, which was last week’s high. Stronger resistance now stands at $408-$409.33
Google Inc. (GOOG) shocked the market in October when earnings blew away estimates. The stock rallied from a low of $480.96 to a high of $599.60 in just under two weeks, posting a near-20% gain.
- Last week, GOOG just reached the weekly trend line resistance at $618 before closing lower
- There is next good support at $572 and then in the $558-$562 area
- The weekly Starc- band is at $530 with the weekly trend line support at $480
- The weekly RS moved sharply above its weighted moving average in July and in October, it broke through its long-term downtrend, line f
- The weekly OBV gives a much more negative outlook, as it shows a well-defined downtrend, line g
- The daily OBV (not shown) has just dropped below its weighted moving average, suggesting further short-term weakness is likely
NEXT: More Big Tech Stocks Under Pressure
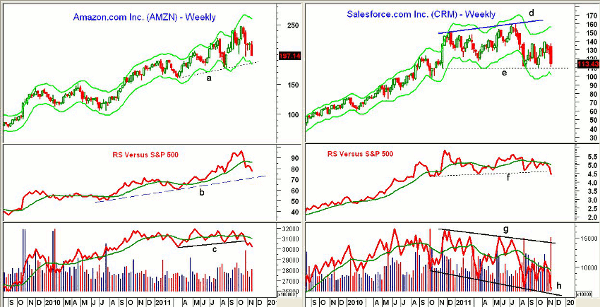
|pagebreak|Amazon.com (AMZN) is always under closer scrutiny approaching Black Friday. The stock is down over 20% from the October highs at $246.70. There is weekly trend line support, line d, in the $186 area with the weekly Starc- band at $183.
- The weekly RS analysis confirmed the October highs but has since dropped below its weighted moving average. There is longer-term support at line b
- The weekly pattern suggests it may take several months before the RS analysis is able to bottom out
- Selling has been heavier in the past month, as the weekly OBV has dropped below support at line c. It is well below its declining weighted moving average
- The daily OBV (not shown) is also negative, though AMZN is quite close to its daily Starc- band, so a bounce is possible
- There is first resistance at $222.35-$225, which covers the gap from October 26
Salesforce.com Inc. (CRM) was hit hard last week, and while earnings beat expectations, third-quarter billings were disappointing. After peaking above $160, CRM has dropped over 29%.
- CRM closed just above the major weekly support, line e, in the $109 area. This is also just above the major 38.2% support level. The weekly Starc- band is at $101.70
- The RS line has already broken key weekly support at line f. It is below its declining weighted moving average and is forecasting much lower prices
- The weekly OBV formed a negative divergence at the recent highs (line g) by making lower highs while prices were forming higher highs, line d
- The weekly OBV also has formed lower lows, line h
- There is first resistance at last week’s high of $137.36 and further resistance at $140
What It Means: The weekly technical outlook for Amazon.com (AMZN) and Salesforce.com (CRM) suggests that both have room to move lower. Therefore, any rebounds in these shares before the end of the year should be watched closely.
Apple, Inc. (AAPL) looks the most interesting and could be bought at stronger support. Google, Inc. (GOOG) is likely to decline further, and while the RS analysis looks strong, the volume action does not. As a result, it should be watched on a further decline.
How to Profit: For Apple Inc. (AAPL), buy at $356.60 with a stop at $339.20 (risk of approx. 4.9%). Sell half the position at $406.40 and raise the stop on the remaining position to $354.90.


