The rise of homebuilding stocks has helped vault the industrial sector into a leading role in early 2012, and investors can now look to buy select homebuilders on future pullbacks.
As I noted in last week’s sector review, the weekly relative performance analysis of the Select Sector SPDR - Industrials (XLI) has turned positive, as it is leading the S&P 500.
The homebuilding industry group is one of the stronger components of this sector, and it now appears that this group completed a significant bottom in October. It has been a long time since the Dow Jones Home Construction Index completed its weekly head-and-shoulders top in 2006.
In October, heavy volume in homebuilding stocks was an important signal that accumulation was taking place, and several stocks completed double-bottom formations.
These stocks are now up sharply from their October lows and reaching major resistance, meaning now is not the time to buy, but now is the time to determine the levels where new buying should be done.
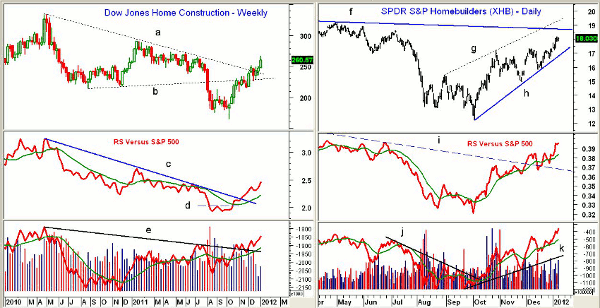
Chart Analysis: The weekly chart of the Dow Jones Home Construction group shows that the downtrend going back to the early-2010 highs (line a) was decisively overcome last week. This index traded over 1120 in 2005.
- There is next major resistance in the 290-330 area
- The relative performance, or RS analysis, completed a short-term bottom in October when it moved through resistance at line d
- This was confirmed when the long-term downtrend (line c) was also broken. The RS looks strong, as it is well above its sharply rising weighted moving average (WMA)
- The weekly on-balance volume (OBV) broke through the downtrend from the 2010 high, line e, in October
- The former resistance in the 230 area, line b, now becomes good support
The SPDR S&P Homebuilders ETF (XHB) has had a nice run from the October 4 lows at $12.21 and is now close to next strong resistance, line f, in the $18.75 area.
- Upper trend line resistance is at $19.40 with longer-term resistance from 2008 in the $22.50-$25 area
- The daily RS analysis also looks strong, as its two-year downtrend, line i, was overcome in December
- OBV is now confirming the higher prices and is well above its sharply rising weighted moving average
- The break of the downtrend in the OBV (line j) on October 12 was a positive sign
- There is first good support now at $17.50 and then in the $16.50 area
NEXT: Top Homebuilding Stock Is Candidate for New Buying
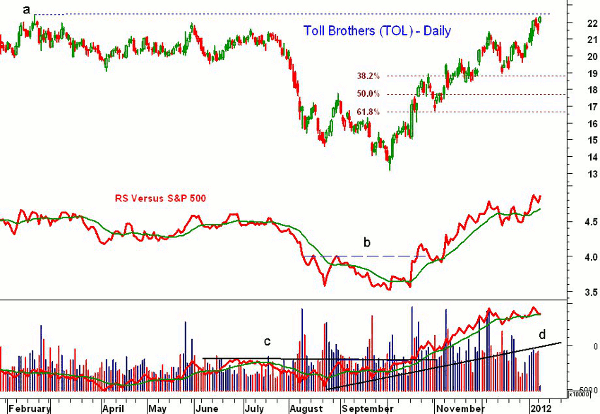
|pagebreak|Toll Brothers (TOL) spiked to a low of $13.16 in early October and is now very close to the 2011 highs at $20.45, line a. TOL traded as high as $56 in 2005, so the major 50% Fibonacci retracement resistance is at $30.50.
- The RS analysis did not confirm the price lows in October and then moved through resistance, line b, on October 20. It did confirm the recent highs
- Weekly RS analysis (not shown) is also positive
- The daily OBV broke through strong resistance in October (line c) and is well above the long-term support at line d
- Weekly OBV (not shown) is positive and has confirmed the price action
- There is first support now at $20.30 and then further support in the $18.50-$18.80 area
What It Means: It looks as though the homebuilders may shine in 2012 as the weekly RS and OBV analysis are both decidedly positive.
The key test will be the first correction, which is likely in the next month, although the daily indicators have not yet given sell signals. Do not chase the long side, but instead look to buy on a decent correction.
Lennar Homes (LEN) will report earnings on Wednesday, January 11, and it will be interesting to see how the market reacts to that report.
How to Profit: I previously recommended buying the SPDR S&P Homebuilders ETF (XHB) on October 15 at $15.28, and buyers at that level should have sold half the position at $17.46 on January 3. Use a stop at $15.74 on the remaining position, and look to buy again at $16.86 with the same stop level.
For Toll Brothers (TOL), go 50% long at $19.12 and 50% long at $18.14 with a stop at $16.66 (risk of approx. 10.5%).


