A big volume spike in one asset management stock is bullish for the whole industry group, and these two stocks look ready for fast, 15%-20% moves higher.
Stocks again closed strong on Thursday as bullish fundamentals reassured late buyers. A strong close today on positive Advance/Decline (A/D) ratios would reverse some of the negative divergences that I discussed yesterday.
This would suggest that the S&P 500 could test the 1370 area and possibly the major 78.6% Fibonacci retracement resistance at 1381.5. This correlates to $138.26 for the Spyder Trust (SPY), which is 1.6% above Thursday’s close.
Many industry groups are quite overextended with first quarter gains of over 30% in home construction, gaming, and office supply stocks. There are some industry groups that have been lagging but are now showing signs that they have bottomed. One such group is the asset managers, and Lazard Ltd. (LAZ) surged Thursday on over seven times the average daily volume.
Traders and more aggressive investors could look to buy these two asset managers on any slight pullbacks while using fairly tight stops.
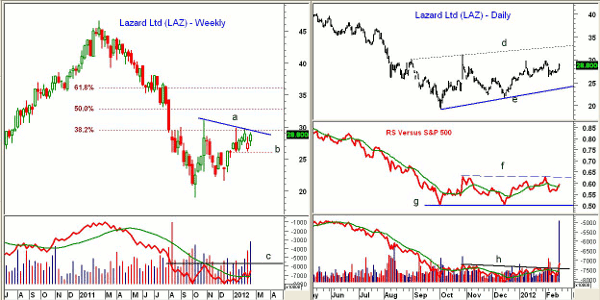
Chart Analysis: Lazard Ltd. (LAZ) is a $3.4 billion asset management company that currently offers a yield of 2.3% ($0.64 annually). LAZ dropped back to test support in the $26 area (line b) last week before turning higher this week.
- The weekly downtrend, line a, and the 38.2% Fibonacci retracement resistance are at $29.50
- The 50% retracement resistance is at $32.85 with the 61.8% resistance at $36.20
- The weekly on-balance volume (OBV) is above its weighted moving average (WMA) but needs to move through resistance at line c to confirm that a bottom is in place
- Volume so far this week has been the heaviest since last August
The daily chart of LAZ shows a broad trading range, lines d and e. It had a high in 2011 of $46.54 and at the September lows had lost over half its value.
- There is initial resistance at the late-October highs of $31.15 and then at $32.85 (line d) and the 38.2% resistance level
- The relative performance, or RS analysis, is also in a trading range (lines f and g) but has moved above its weighted moving average
- Thursday’s massive volume shows up clearly on the daily chart and the OBV has moved above resistance at line h
- Very short-term support is now at $27.30-$28.30. If the short-term support at $26 is broken, the lower support (line e) is now just below $24
NEXT: Big Bank Sits on Verge of a Big Move
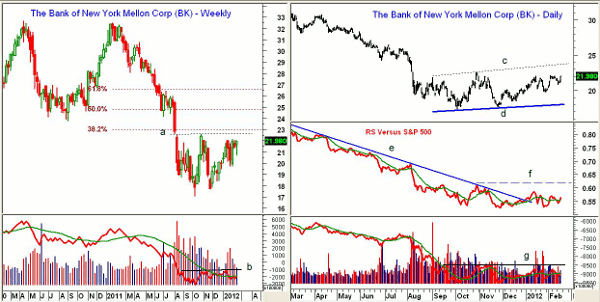
|pagebreak|The Bank of New York Mellon Corporation (BK) is a much larger, $26.6 billion asset management company that currently yields 2.4% ($0.52 annually).
- The weekly chart shows next resistance at $22.57 with the 38.2% Fibonacci retracement resistance at $23.10
- The 50% retracement resistance is at $24.80 with the 61.8% resistance at $26.65
- Weekly volume is less impressive than that of LAZ, as it is still below its weighted moving average. A move through resistance at line b will confirm a bottom
- The weekly chart shows important support in the $19.74 area
The daily chart of BK also shows a broad trading range with resistance at $23.70 (line c) and support at $17.95 (line d).
- The RS line broke through its long-term downtrend, line e, late last year
- The RS line is trying to bottom and is back above its weighted moving average but needs to move above resistance at line f to confirm a bottom
- The OBV is still below resistance at line g, and a higher close on heavy volume is needed to complete a bottom
- There is now short-term support at $20.75-$21.40
What It Means: The volume surge in Lazard Ltd. (LAZ) could be a sign that this industry group is ready to move. The bullish interpretation of the daily chart is that these two stocks are completing multiple bottom formations that once completed will signal a move to the major 50%-61.8% retracement resistance.
The bearish interpretation is that the trading ranges are just continuation patterns, or pauses in the downtrend from the 2011 highs. New longs established on slight pullbacks have the potential for a 15%-20% gain. If these stocks hit stronger resistance first, however, I would recommend canceling the orders.
How to Profit: Lazard Ltd. (LAZ) has the potential to gap higher on Friday, and while it may be a good momentum play for daytraders, others should not chase it.
Go long LAZ at $28.28 or better with a stop at $25.95 (risk of approx. 8.2%). Cancel the order if $29.70 is hit first. Sell half the position at $31.60 or better and raise the stop to breakeven on the remaining position.
For the Bank of New York Mellon Corporation (BK), go long at $21.46 or better with a stop at $19.98 (risk of approx. 6.8%). Cancel the order if $23.50 is hit first. Sell half the position at $23.90 or better and raise the stop to breakeven on the remaining position.


