
Seasonal patterns suggest another strong month for stocks is ahead, and any substantial pullbacks in these semiconductor stocks—or in the broader markets—may present good buying opportunities.
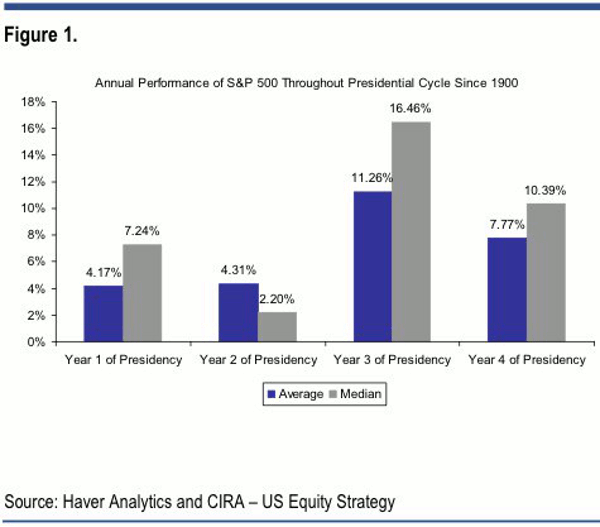
The stock market performance in 2011 was disappointing for those who follow the Presidential cycle, as the third year of the cycle is generally the best. So far, 2012 is making up the difference, as it historically has been the second-best year.
The table below shows that on average since 1900, the fourth year of the Presidential cycle averaged a 7.77% gain versus 11.26% in the third year. With the Spyder Trust (SPY) already up 9.3% this year, stocks have exceeded that yearly average and are approaching the median return of 10.39%.
Click to Enlarge
The long-term monthly performance in the fourth year of each cycle reveals that March has been up 68% of the time since 1885, posting an average gain of 1.2%. Only August had higher percentages, as the markets moved higher 74% of the time and averaged gains of 2.4%. December has been an up month 68% of the time as well, and the average gain has been 6.9%.
Seasonal analysis of the various industry groups shows that the Market Vectors Semiconductor ETF (SMH) typically bottoms in October and then has a last surge to the upside in March and April before it typically tops out. Today, we'll profile two semiconductor stocks that are lagging the ETF, but both appear to have bottomed at good support.
NEXT: 2 Semiconductor Stocks to Buy on Corrections
|pagebreak|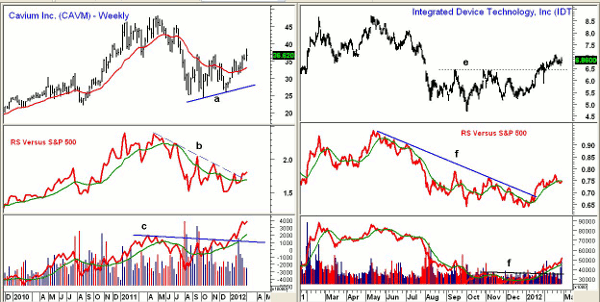
Click to Enlarge
Chart Analysis: Cavium Inc. (CAVM) is a $1.9 billion developer and designer of semiconductor processors. From its April 2011 high of $47.90, the stock dropped to a low of $24.20 in October.
- CAVM moved above the weekly resistance at $36.93, and a weekly close above this level would be positive
- The 61.8% Fibonacci retracement resistance is at $39.20 with strong chart resistance in the $44-$45 area
- The relative performance, or RS analysis, moved above its downtrend, line b, and its weighted moving average (WMA)
- Weekly on-balance volume (OBV) overcame major resistance, line c, in December and has surged to the upside
- There is first support for CAVM at $36-$36.40 with more important support at $35
Integrated Device Technology, Inc. (IDTI) is a $970 million broad-line semiconductor company that completed its bottom formation in January when resistance at line d was overcome.
- The next significant resistance is now at $7.50 with stronger resistance above $8.00
- The RS line broke through its downtrend, line e, last month. This signaled that IDTI was starting to outperform the S&P 500
- OBV confirmed completion of the bottom formation in January when it moved above resistance at line f
- IDTI has pulled back from its recent high at $7.10 and has next support in the $6.40 area
What It Means: Though the stock market is still overextended, the short-term divergences in the Nasdaq 100 have been resolved, while the Russell 2000 Advance/Decline (A/D) line is still diverging from prices.
The historical evidence favors higher prices in March, so when we get a decent pullback, it should be a buying opportunity.
How to Profit: For Cavium Inc. (CAVM), go long at $36.24 or better with a stop at $34.78 (risk of approx. 4%).
For Integrated Device Technology, Inc. (IDTI), the risk is higher, so go 50% long at $6.78 and 50% long at $6.54 with a stop at $6.16 (risk of approx. 7.5%).


