
Technical weakness in four key global ETFs preceded, or even predicted, the current decline in the US market, making their latest price action especially crucial.
The early-April decline in the German DAX Index below the March lows was a warning to me that stronger world markets, including the US, also had the potential to violate their March lows.
Earlier this week, I was discussing relative performance (RS analysis), or what some refer to as “comparative relative strength analysis,” with veteran trader and old friend Linda Raschke. She suggested that I also look at the recent action of some key global ETFs like the iShares MSCI Brazil Index Fund (EWZ), the iShares FTSE China 25 Index Fund (FXI), the WisdomTree India Earnings Fund (EPI), and the iShares MSCI Japan Index Fund (EWJ).
Linda’s analysis of these funds last month confirmed her hypothesis that the US markets were also ready to move lower. For those looking to learn more about relative strength analysis, I think you will find this Webcast segment from Linda very informative.
Linda also shared some additional insights "When you want to trade the short side, pick the weakest. If the markets build a bit of a base and look poised for upside again, then you want to buy the relative strength leaders. If there is no confirmation from the other indexes, than the upside is not going to get very far. On this last selloff, all global indexes were making new momentum lows, so one could have traded the short side with added confidence."
These funds often lead the US market both lower and higher, and the relative performance analysis of the iShares MSCI Brazil Index Fund (EWZ) bottomed two months ahead of the US market in January 2009. Let’s look at what these funds are telling us now.
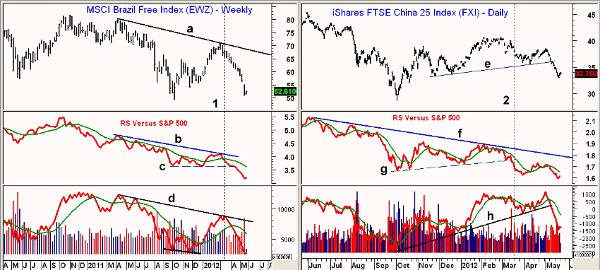
Click to Enlarge
Chart Analysis: The weekly chart of the iShares MSCI Brazil Index Fund (EWZ) shows the rally from the October 2011 low at $49.25 to the high of $70.74 in early March. Through last Friday (May 18), EWZ has dropped 27.1% from its highs versus just an 8.8% decline in the Spyder Trust (SPY).
- If the October lows are broken, next good support is in the $44-$45 area
- RS analysis rebounded above its weighted moving average (WMA) late last year but failed to start a new uptrend
- The RS dropped back below its weighted moving average in March (line 1) and then dropped below support at line c. This was a sign of weakness and forecast an even more serious decline
- The RS line is in a clear downtrend and would need to move through its downtrend and above the March highs to turn positive
- Weekly on-balance volume (OBV) just tested its downtrend, line d, in March before dropping below its weighted moving average
- OBV made lower lows in October and was acting weaker than prices
- First strong resistance for EWZ is now in the $56-$57 area
The iShares FTSE China 25 Index Fund (FXI) reached a high of $40.67 in early February and was unable to make it much higher even though the US market continued to make higher highs.
- The break below support at $36 (line e) on May 9 completed the top formation and gave downside price targets in the $30-$31 area
- RS line failed to start a new uptrend while FXI was moving higher in early 2012, and it was unable to move above the October highs
- RS dropped below key support, line g, on March 17 (line 2), which was almost seven weeks before prices broke support
- RS line shows no signs of bottoming. Longer-term resistance is at line f
- OBV was stronger than prices in April, and the break of its support, line h, coincided with the price break
- The former support, line e, at $36 is now the first key level of resistance
NEXT: Latest Signals from Key India and Japan ETFs
|pagebreak|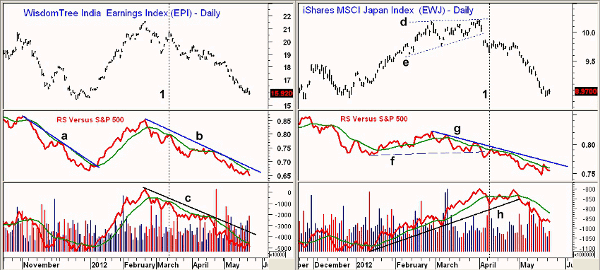
Click to Enlarge
The WisdomTree India Earnings Fund (EPI) peaked at $21.59 on February 21 and is now down 26% from those highs. EPI is now very close to the late-2011 lows at $15.44. In 2009, the low was $8.81.
- RS analysis bottomed in January 2012 when the downtrend, line a, was overcome
- RS line stayed above its weighted moving average until February 24 and soon formed a pattern of lower lows
- RS line rebounded back to its now declining weighted moving average on March 13 (line 1). The daily downtrend, line b, is still intact
- OBV shows a similar formation, as it also peaked in February and has been weaker than prices since April, line c
- There is a band of resistance now in the $17-$18 area
The iShares MSCI Japan Index Fund (EWJ) gapped below support on April 4, which completed the daily top formation, lines d and e. EWJ is now down over 12% from the high at $10.21. A violation of weekly chart support in the $8.75 area would be much more negative.
- The RS line started to diverge from prices in early March when it made lower highs (line g) while prices were making higher highs
- In early April, the RS line broke support, line f, which was a negative sign and forecasted that prices would follow lower
- The RS is still in a well-established downtrend, line g
- OBV was much stronger than the RS, as it confirmed the price highs in late March and stayed above its uptrend, line h, until early May
- There is near-term resistance now in the $9.50-$9.70 area
What It Means: I generally use relative performance (RS analysis), or comparative relative strength, as a tool to find market-leading sectors, industries, or stocks. It is an important tool that can help you find the best places to invest, as well as those to avoid.
As Linda pointed out, it can also be a useful tool in supporting or contradicting other methods of analysis.
By April, the RS analysis of these four global ETFs had turned negative while the Dow Industrials, Nasdaq 100, and S&P 500 all continued to move higher. Each of these ETFs still look negative, which suggests that the decline in the US stock market will continue, although I do not expect to see the US indices drop as much as these ETFs.
How to Profit: No new buy recommendations at this time.
Portfolio Update: Buyers should be 50% long the ProShares Short S&P 500 ETF (SH) at $36.26 and 50% long at $36.06. Use a stop at $36.88 and sell half the position at $39.22 or better.


