The strong technical action of the small-cap indices suggests that the annual fire sale of small-cap stocks may already be over. MoneyShow.com's Tom Aspray has suggestions on how to participate in this historical period of small-cap strength.
Another strong day for the stock market Tuesday even though pessimistic comments over the fiscal cliff negotiations spurred some late selling. The iShares Russell 2000 (IWM) gained 1.05% while the Spyder Trust (SPY) was up just 0.68%.
The markets are nervously waiting for the FOMC announcement this afternoon with most expecting that the Fed will announce further easing of their monetary policy. This is likely already factored into the stock market so if the Fed disappoints the market it could cause a sharp but I believe a short-term setback.
If the market does pullback what should you be buying? Since 1925, market data indicates that small-cap stocks outperform the broader stock market from mid-December through January. As I noted in last year’s column “The prevailing explanation for this so-called “January Effect” is that investors dump their small-cap losers before the end of the year to book their losses, and this pushes many of theses stocks to bargain levels. This, in turn, sets the stage for a sharp oversold rally into January.”
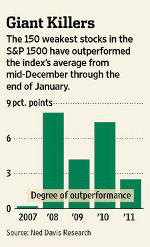
Using data from Ned Davis Research, this WSJ chart shows how much the weakest stocks in the S&P 500 have outperformed the average from the middle of December through the end of January in the last few years.
According to the WSJ, from 1996 through 2009, the Davis January Effect Stock portfolio “returned an average of 8.6% from mid-December through the end of January, well above the 1.2% gain in the S&P 500.”
There are signs now that the small-cap sector is starting to lead the S&P 500 and these two closed-end small-cap funds should provide a good way to participate in this annual trend.
Chart Analysis: The iShares Russell 2000 (IWM) broke its downtrend, line a, on November 28 and it closed above the 61.8% Fibonacci retracement resistance Tuesday.
- The pullback last week held well above the rising 20-day EMA with first good support in the $81.40-$82.50 area.
- There is next resistance for IWM at $84.15 to $85.25 with the September high at $86.96.
- The relative performance has just broken its downtrend, line b, and shows a very positive formation.
- The daily on-balance volume (OBV) broke its downtrend, line c, in November and is still rising strongly.
- The weekly OBV (not shown) is also now above its WMA.
- The key support is at $79.63 (see arrow), which was the November 28 low.
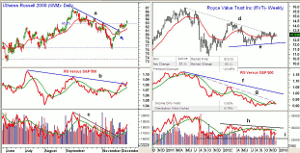
The Royce Value Trust Inc. (RVT) is a closed-end fund with a capitalization of $1.1 billion and an expense ratio of 0.68%. The best site I have found for data on closed-end funds is the Closed End Fund Center, and I have inserted their data into this chart. RVT has a well-diversified small-cap portfolio.
- RVT closed Tuesday at $13.02, which was a discount of 13.49% from its NAV of $15.05. The CEF site also breaks the yield down into the income and distribution yield component.
- The weekly downtrend in RVT is now being tested and a close above $13.35 would confirm that the uptrend has resumed.
- There is further resistance at $14.40, which was the March 2012 high.
- The relative performance is testing its short-term downtrend, line g, and is trying to bottom.
- The long-term downtrend in the RS line, line f, needs to be overcome to confirm a bottom.
- The weekly OBV is back below its WMA and is locked in a trading range, lines h and i.
- The daily OBV (not shown ) has moved above its WMA.
NEXT PAGE: Another Fund to Play the January Effect
|pagebreak|The Royce Micro-Cap Fund (RMT) has a capitalization of $1.1 billion with a significantly higher expense ratio of 1.58%. It trades at a similar discount to its NAV.
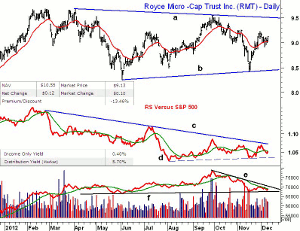
- RMT has recently pulled back to its 20-day EMA with next resistance at $9.26 and then $9.39.
- The daily chart shows a broad trading range, lines a and b, with major resistance at $9.50.
- In 2011, RMT rose from a low of $7.91 in late November to close January 2012 at $9.17 for a gain of 15.9%.
- The daily relative performance appears to be bottoming out and a move above the downtrend, line c, will complete the bottoming formation.
- The daily OBV appears to be holding long-term support at line f, but is still below its WMA.
- There is key daily resistance for the OBV at the downtrend, line e.
- There is first support at $8.95-$9.05, with further at $8.68.
What it Means: Both of these closed-end funds have 30% in the industrial sector, which is one of the sectors that is outperforming the S&P 500. Though the stocks in either of these funds may not be on the new low list for the Russell 2000, most of the small- and micro-caps stocks do well from mid-December through the end of January.
Either is a good way to participate in this trend, but the longer track record and lower expense ratio makes the Royce Value Trust Inc. (RVT) my favorite. I would also buy IWM, but we will need a deeper sharp setback in order to buy.
How to Profit: For the iShares Russell 2000 (IWM), go 50% long at $82.38 and 50% long at $81.42, with a stop at $79.11 (risk of approx. 3%).
For the Royce Value Trust Inc. (RVT), go 50% long at $12.98 and 50% long at $12.83, with a stop at $12.12 (risk of approx. 6%).
For the Royce Micro-Cap Fund (RMT), go 50% long at $9.08 and 50% long at $8.94, with a stop at $8.61 (risk of approx. 4.4%).
Check out the Charts in Play Portfolio


