
The stock market’s powerful start to 2013 has important implications for stocks in the first quarter of 2013 says Moneyshow’s Tom Aspray and picking a good buy level is the key to success.
The stock market has started off the year in an impressive fashion as the S&P 500 had its best daily gain since late 2011. The final agreement was disappointing on many levels, but for investors who have been fixated on the fiscal cliff for the past few months, it has been a frustrating time.
Since early in November (Don't Jump Off the Fiscal Cliff) I have been trying to convince investors that selling in fear over the potential impact of any political or economic debate should not be part of any sound investment plan. Instead one should have a clear plan of what they are willing to risk before they buying. This often will force the investor to buy closer to support.
The difference between success and failure in the investment markets can often be traced to the entry level. Though the setback into the November lows was a bit sharper than expected, there were no signs that a major top had been confirmed.
The positive signals from the market internals in 2012 has favored buying stocks or ETFs that are outperforming the overall market if they drop back to support levels where the risk can be better controlled. In late November, I referred to this as smart buying as often times buying too high means that longs are stopped out just before prices turn around.
The current analysis of the NYSE Advance/Decline line still favors buying stocks at support as it has for the past few weeks. The recent correction allowed us to add new long positions at good levels, but unfortunately the thin year-end selling also stopped us out of some positions. Now is a good time to adjust stops in the Charts in Play portfolio and one sector has now joined the list of market leading sectors.
Click
to Enlarge
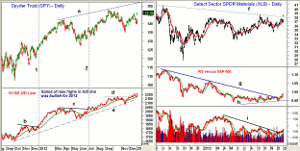
Chart Analysis: The daily chart of the Spyder Trust (SPY) shows the up gap opening Wednesday and the strong close above the December highs.
- There is minor resistance now at $146.52-$147.16 and then the September high at $148.11.
- There is psychological resistance at $150 with the 1st quarter R1 pivot resistance at $150.58.
- The upper trend line on the daily chart (line a) is now at $152.
- The NYSE Advance/Decline closed at new multi-year highs Wednesday as the series of higher highs in 2012 has continued to support a positive outlook for stocks.
- In early 2012 (line 1), the A/D line broke through its resistance, line b, as it was leading the SPY higher.
- There was another upside breakout last July (line 2) as the resistance from March-April, line c, was overcome.
- The move in the A/D line through resistance at line d, in December provided another bullish signal as it is consistent with new rally highs in the SPY.
- The uptrend in the A/D line was briefly broken in November before it resumed its uptrend. This low now represents an important level of support.
The Select Sector SPDR Materials (XLB) gapped through the long-term downtrend, line f, on Wednesday as it is already close to the 2012 high at $38.57.
- The Quarterly R1 resistance is at $39.91 with the April 2011 high at $41.28.
- The relative performance has also broken its downtrend, line g, which completes the bottom formation (line h).
- The weekly RS analysis (not shown) is now also positive suggesting it is leading the S&P 500.
- The daily OBV has moved through its downtrend from the March 2012 highs, line i, but is still well below those highs.
- The weekly OBV (not shown) looks ready to close the week back above its WMA.
- There is initial support for XLB now at $37.60-$38, with the quarterly pivot at $37.12.
NEXT PAGE: A Review of Select Stocks in Our Portfolio
|pagebreak|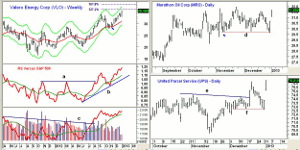
Click
to Enlarge
Valero Energy Corp. (VLO) had a low of $27.89 in October, but has now just exceeded the September high of $34.35. The 127.2% Fibonacci target from the recent correction is at $36.16.
- The weekly starc+ band is at $36.55, with the 161.8% Fib target at $38.42.
- The monthly starc+ band is at $40.12.
- The weekly relative performance broke through its resistance, line a, last September indicating it was a market-leading stock.
- The RS line moved back above its WMA in early November.
- The weekly on-balance volume (OBV) completed a major bottom last summer as resistance at line c was overcome
- The OBV held well above its WMA on the recent correction and continues to look strong.
- There is initial support now at $33.80-$34.20 with the quarterly pivot at $32.97
Marathon Oil Corp. (MRO) was recommended at the same time as VLO as longs were established at an average price of $30.19 when MRO pulled back to $29.70 on November 8.
- MRO made new rally highs in late November at $31.95 before dropping back to a low of $29.73 on December 10.
- As MRO again turned higher, I recommended a stop at $29.62 just below support at line d.
- On Monday, the low was $29.60, hitting the stop.
For United Parcel Services (UPS), longs were established in early November at $72.17 (including commissions).
- The upside breakout in December surpassed the resistance at line e, in the $74.50 area.
- This was well above both the September and October highs.
- This made the prior December lows at $72.73 look like good support.
- The correction from the December 19 highs was clearly sharper than expected as Monday’s low at $72.58 hit the stop at $72.64. (Earlier, a $0.47 dividend was paid.)
- UPS opened Wednesday at $75.09 and closed on the highs.
What it Means: The stock index futures are a bit lower in early trading, and I would expect some consolidation or a pullback in the next few days. This should be a good buying opportunity.
In December, new positions were established in the Select Sector SPDR Consumer Discretionary (XLY) and positions were added in the Select Sector SPDR Financial (XLF) and Select Sector SPDR Health Care (XLV). Positions were also added in homebuilding (XHB) and retail (XRT).
The buy levels for the five stocks recommended in 5 More Stocks For Your Stocking were hit with only McDonald’s Corp. (MCD) being stopped out for a 2.6% loss. My stop at $87.22 was apparently too tight as the low was $86.81.
As I discussed in two articles last year, stop placement can be more of an art than a science and that is why I included Marathon Oil Corp. (MRO) and United Parcel Services (UPS), so that you can learn both when my stops work and when they don’t.
In hindsight, the stop in UPS was too tight, while I think my stop in MRO would have held in the majority of instances.
How to Profit: For Select Sector SPDR Materials (XLB), go 50% long at $38.06 and 50% at $37.72, with a stop at $35.86 (risk of approx. 5.3%).
For Valero Energy Corp. (VLO), on longs from $29.27, use a stop at $32.54. Though the chart looks strong and a rally to $38-$40 is possible, I would stick with my original plan and sell ½ at $35.98 for at 22.9% gain.
NEXT PAGE: The Charts in Play Portfolio
|pagebreak|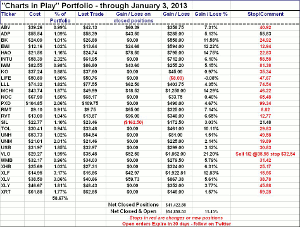
Click
to Enlarge


